| Question |
Answer |
Example
|
How many different
presentations
or window
types
are offered by
UNIFIT?
|
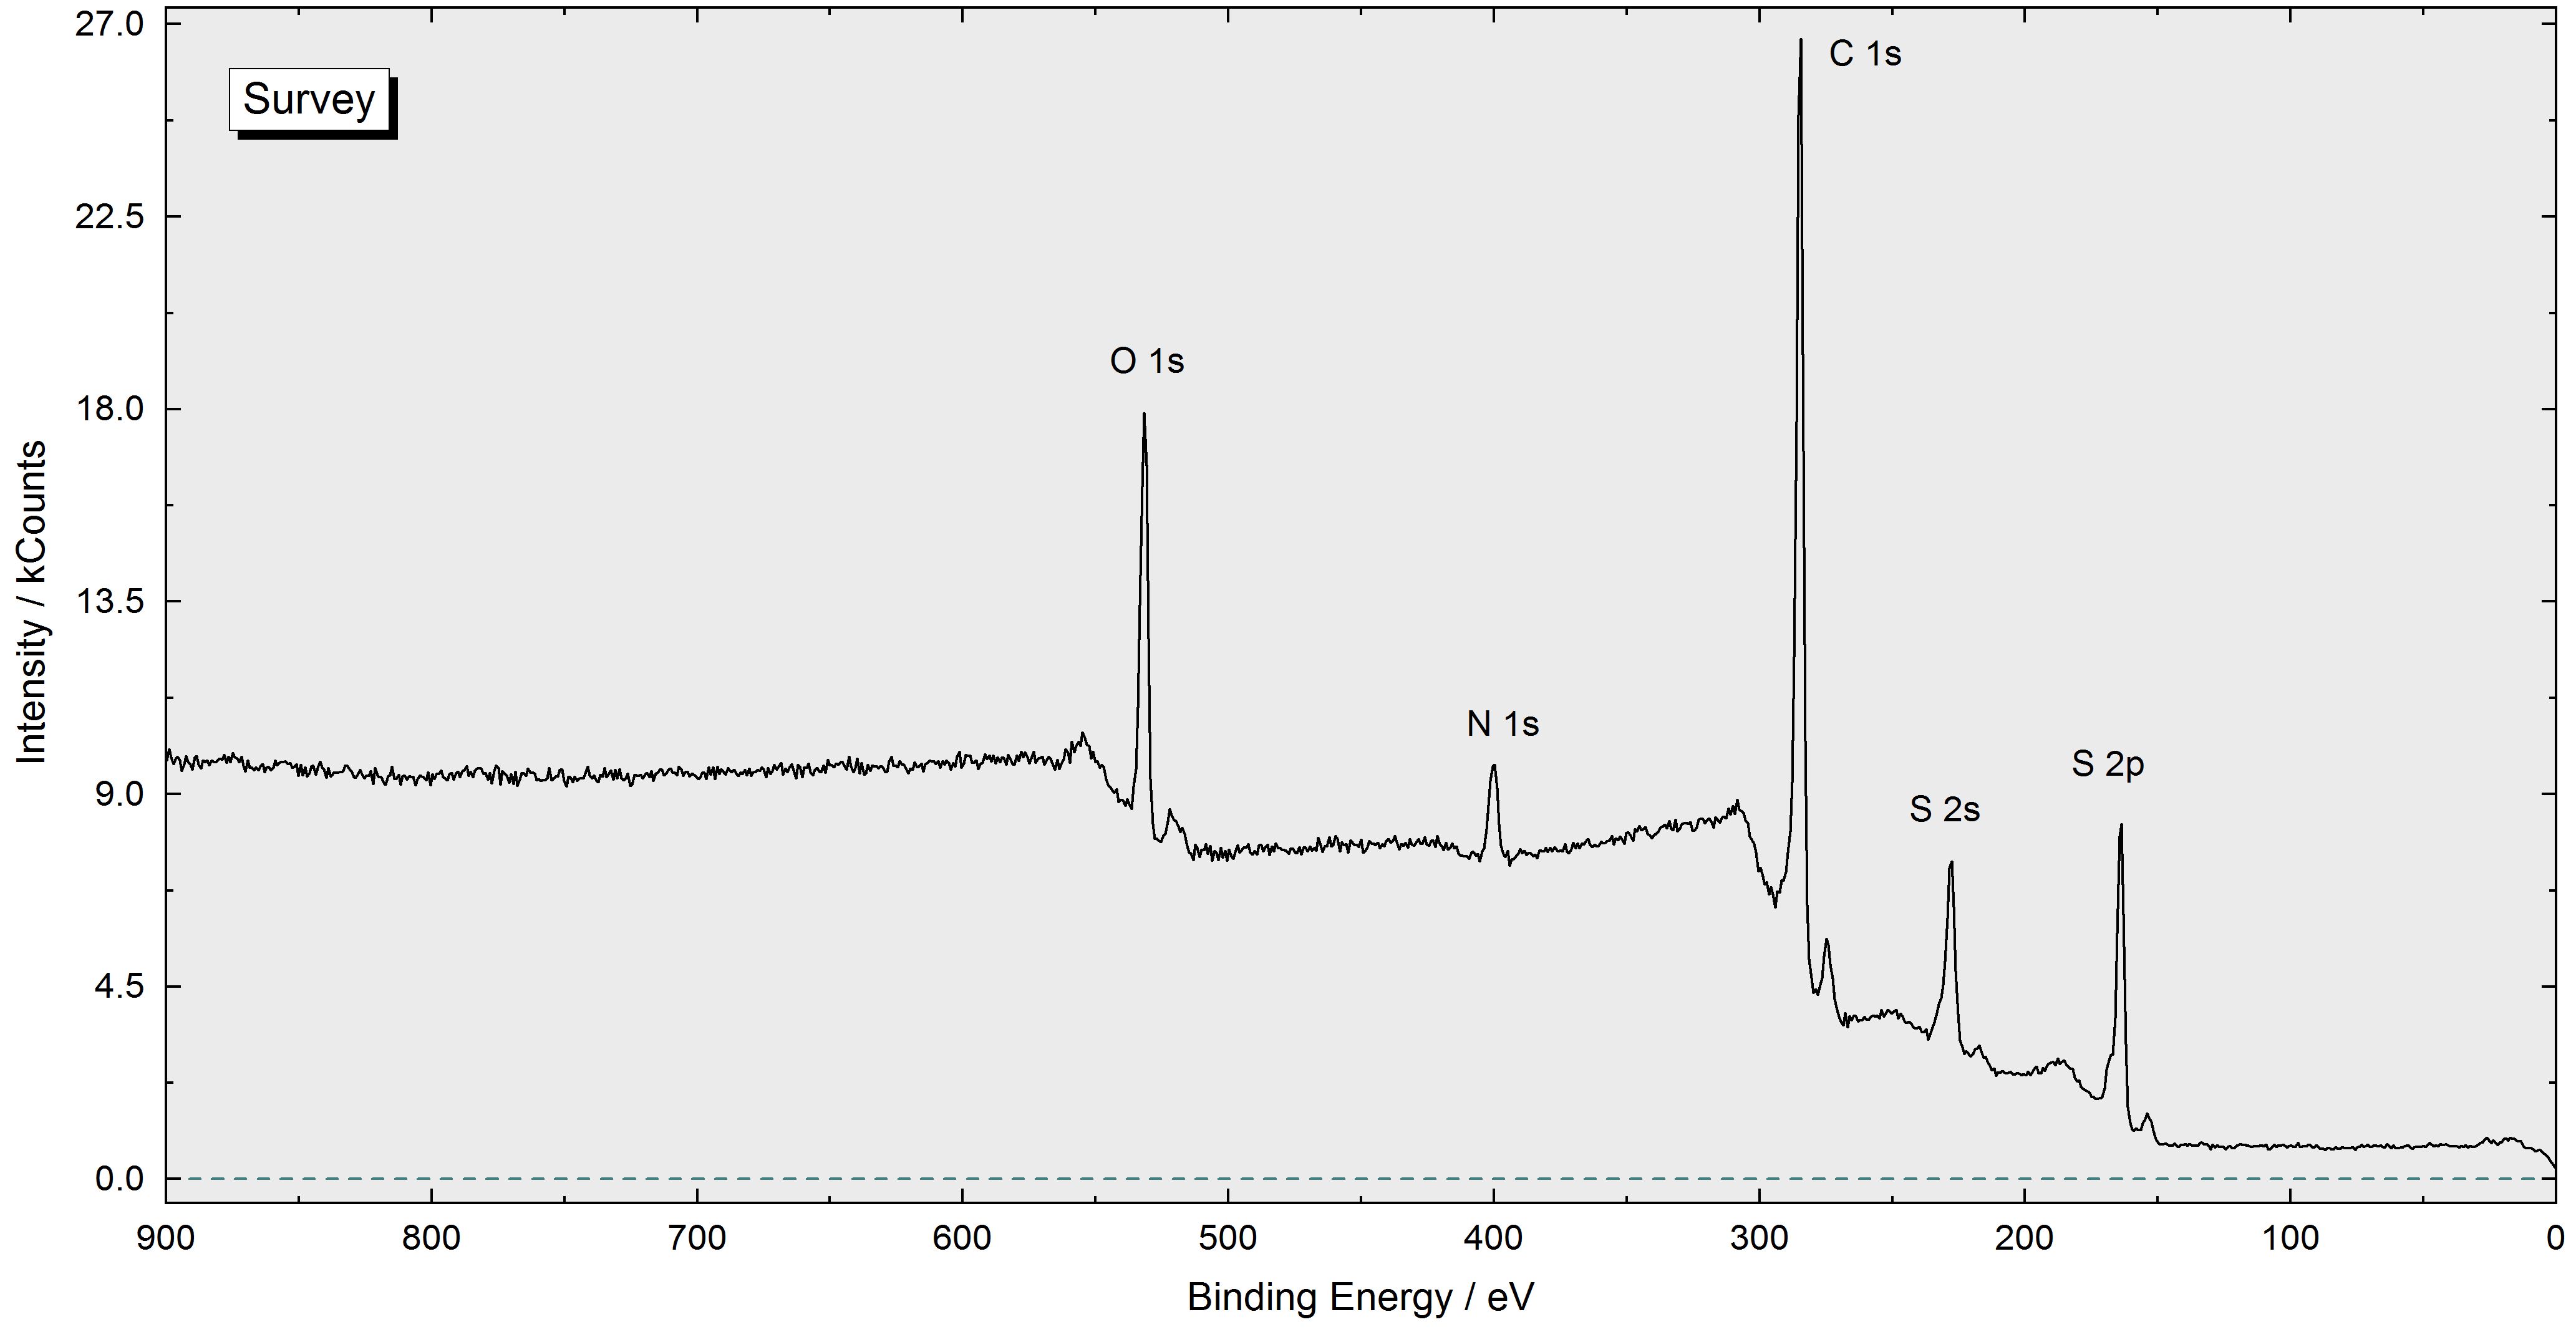
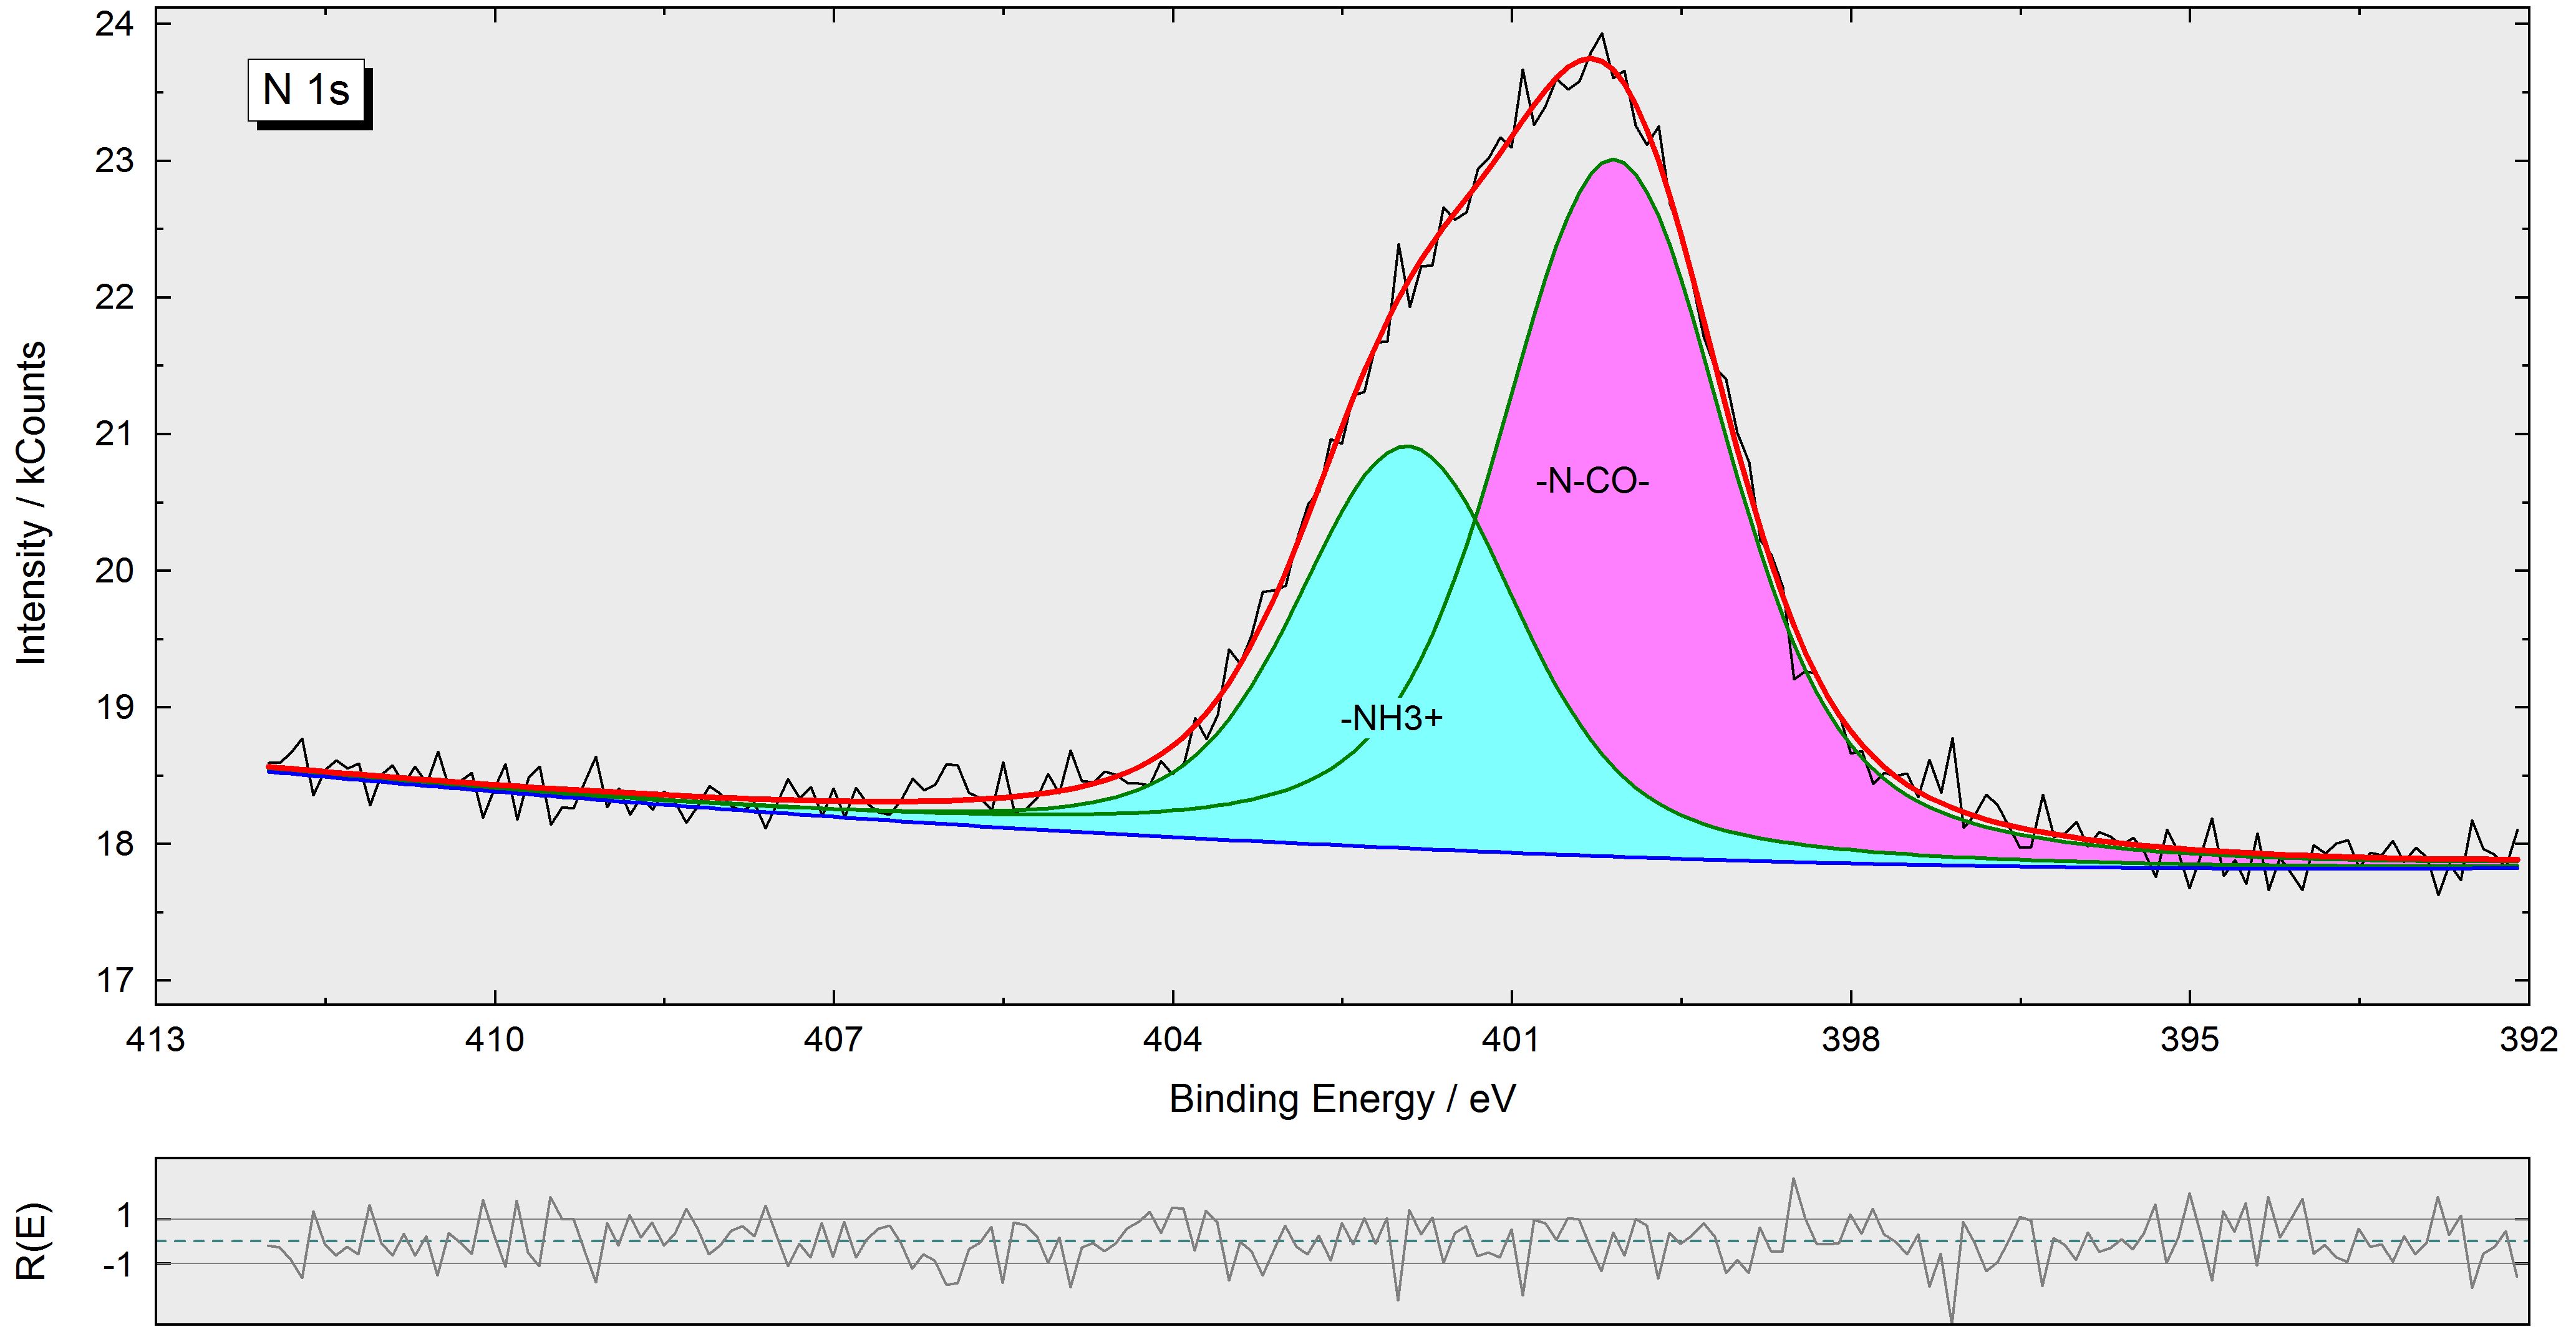
UNIFIT offers 14 different
presentations or window types.
1. Standard
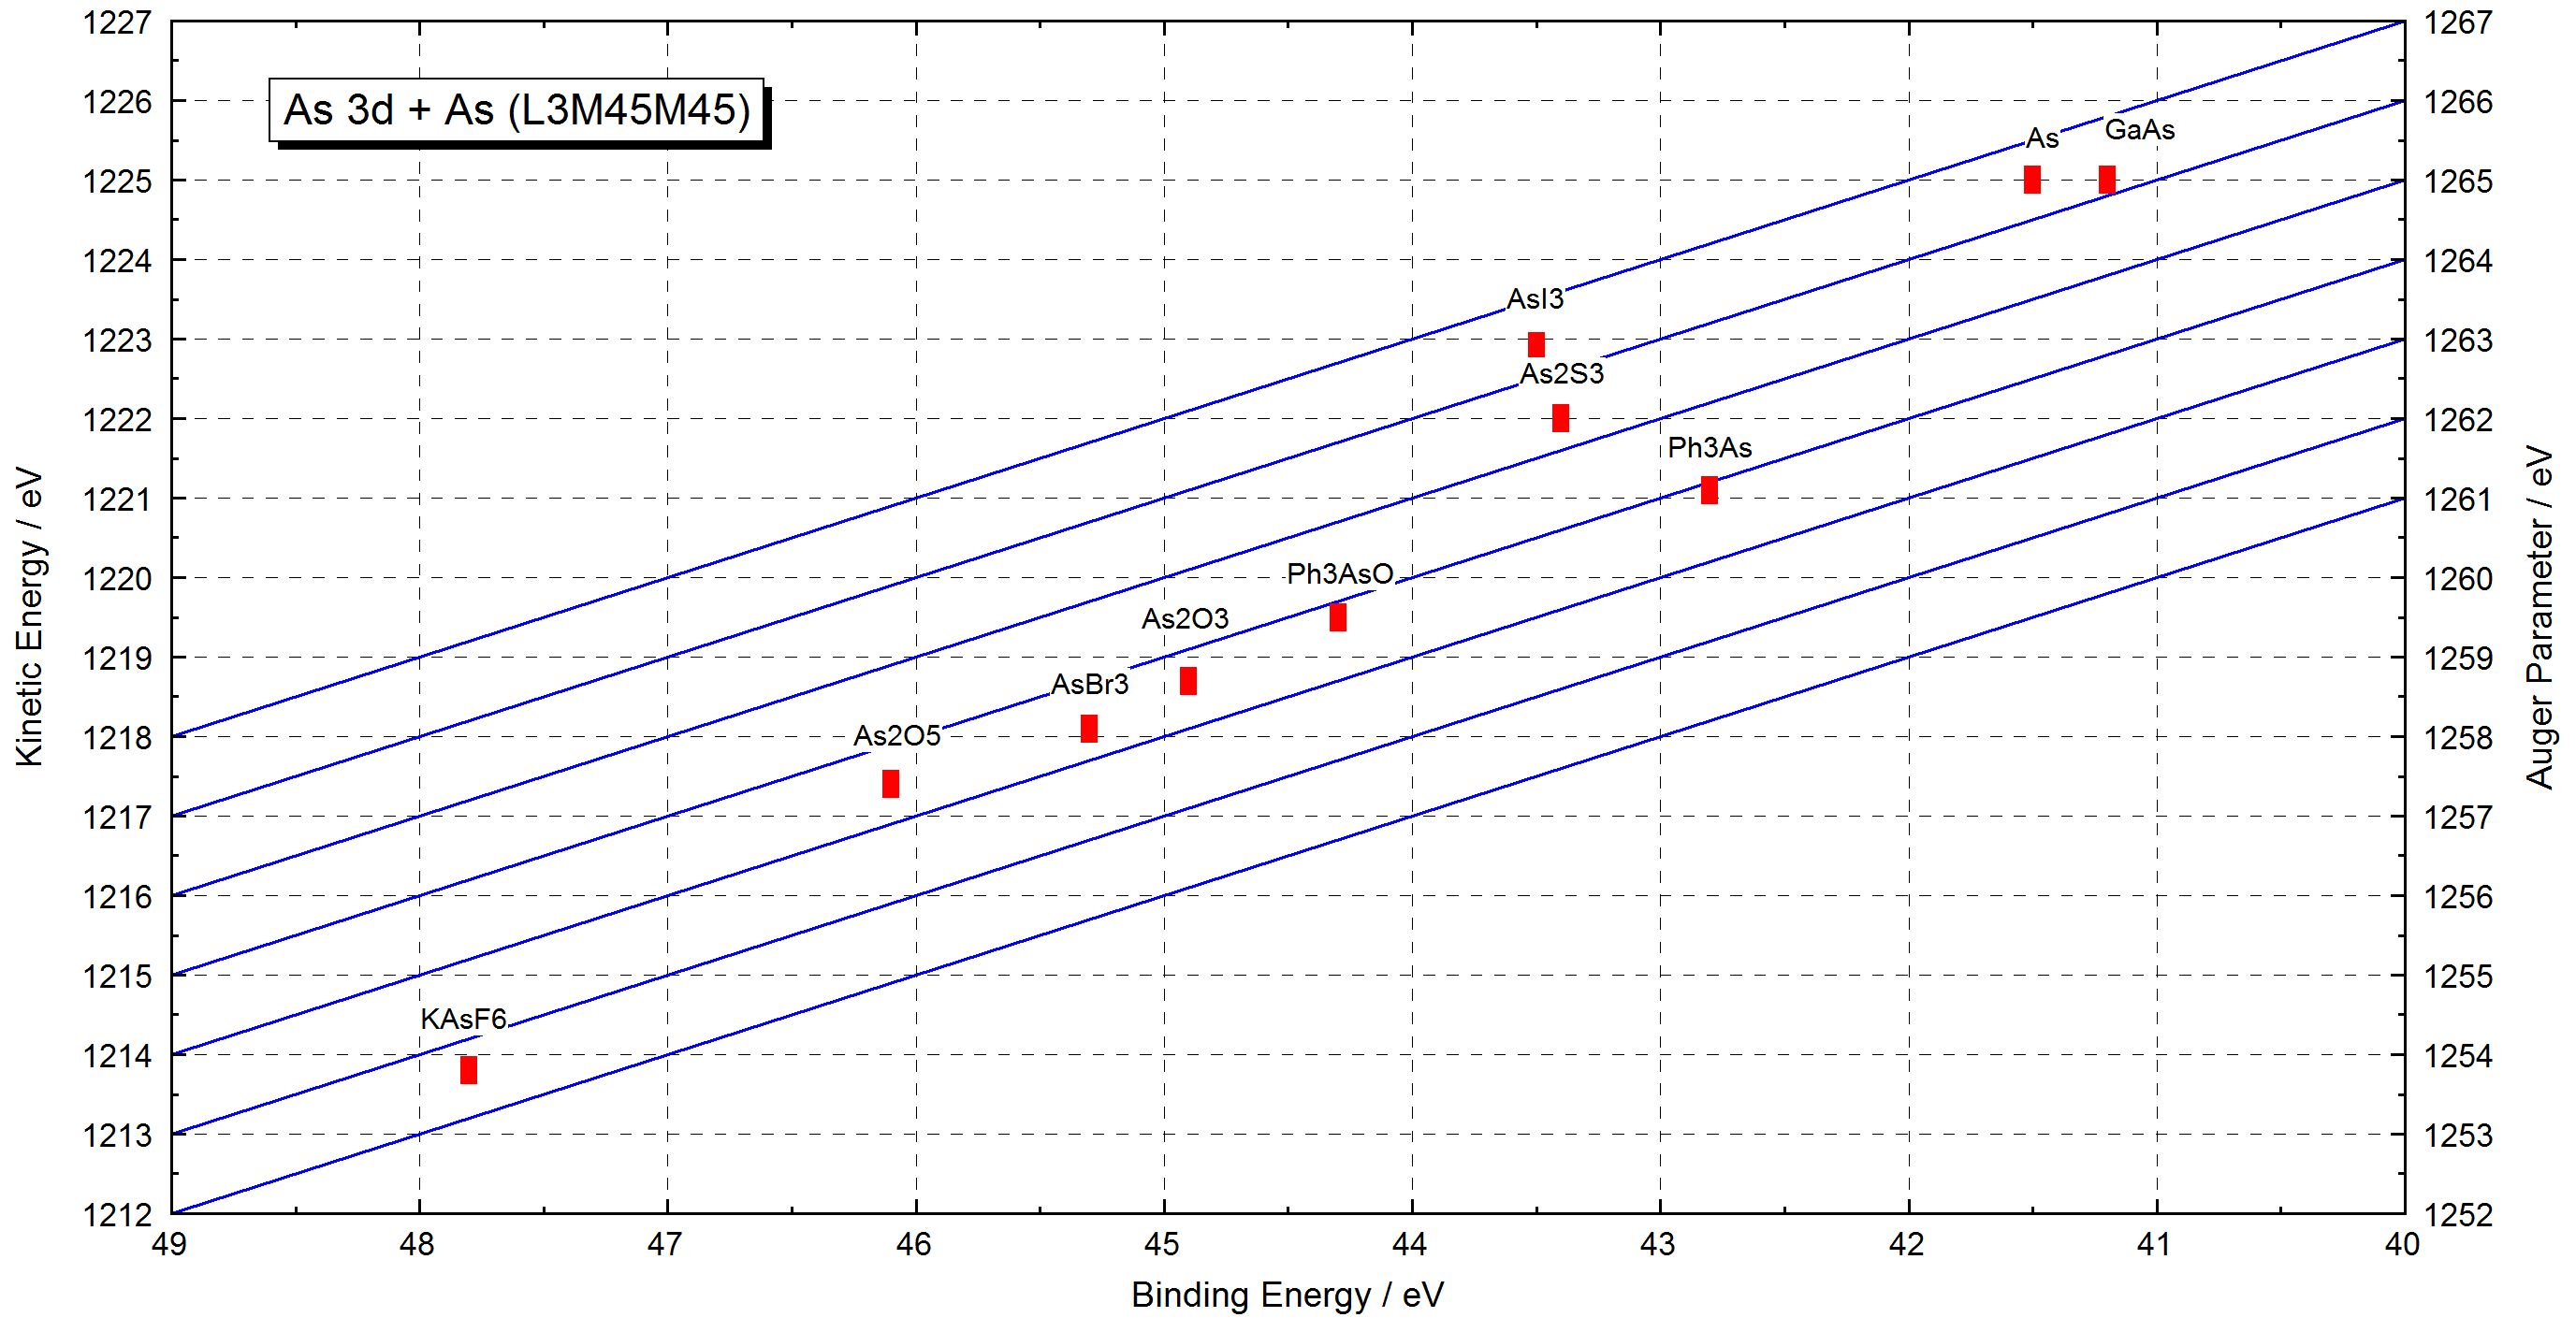
2. Wagner Plot
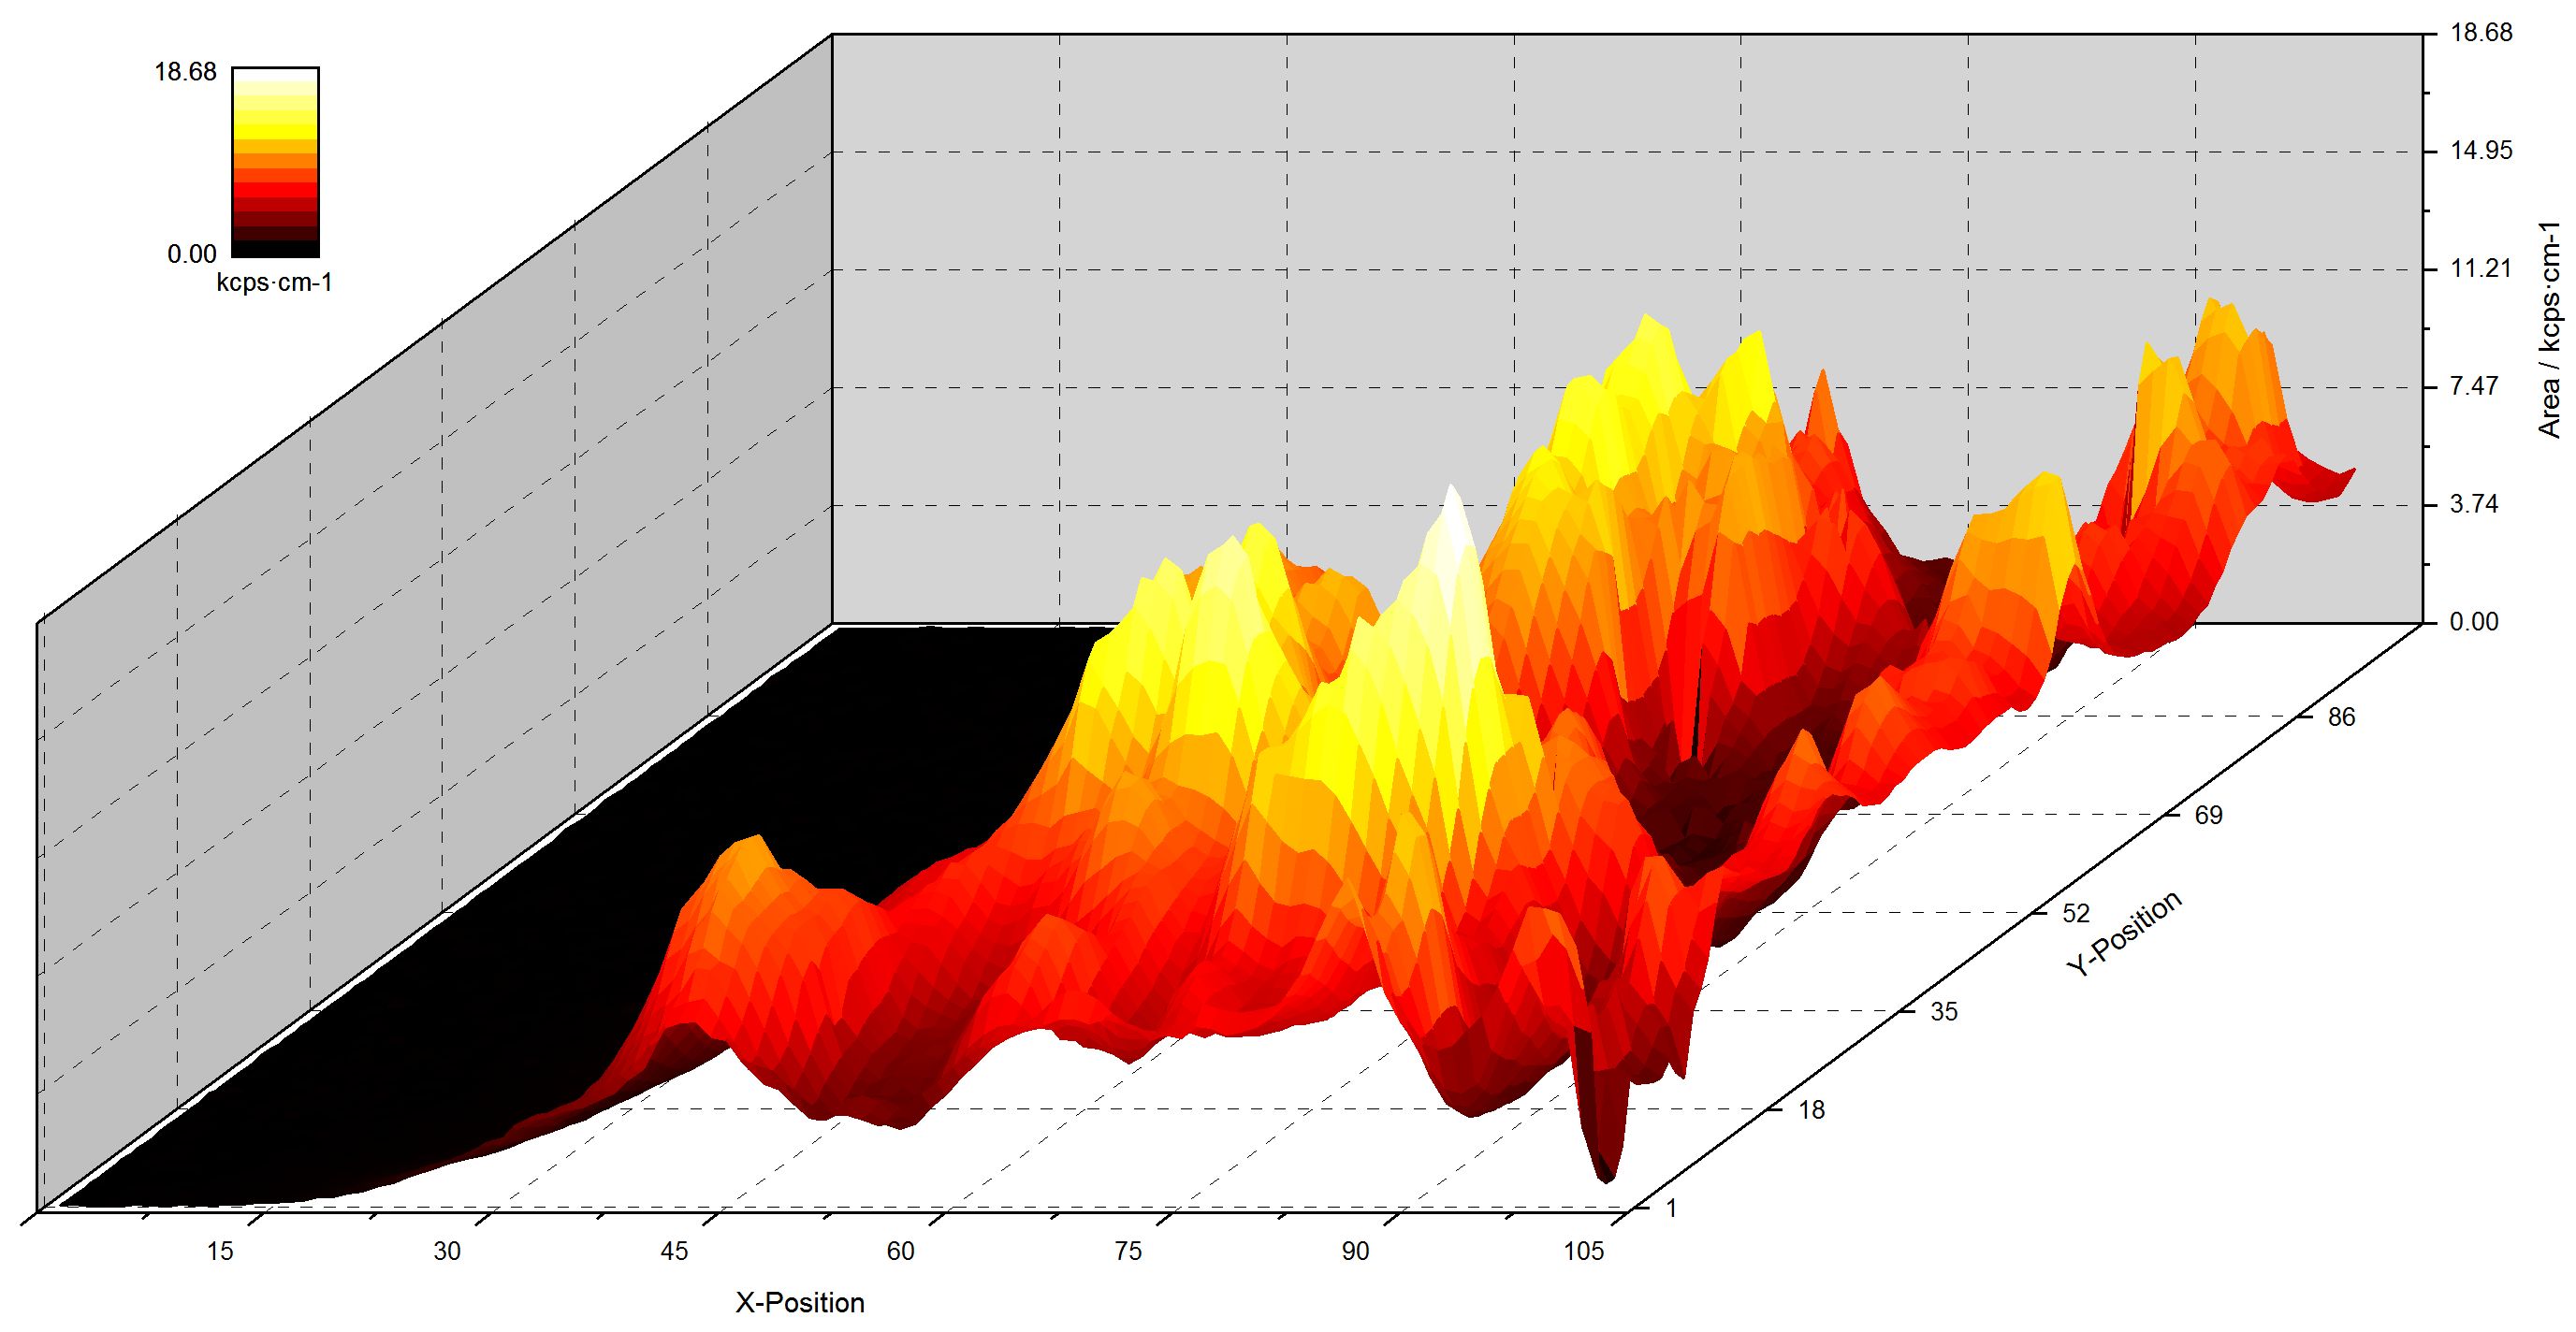
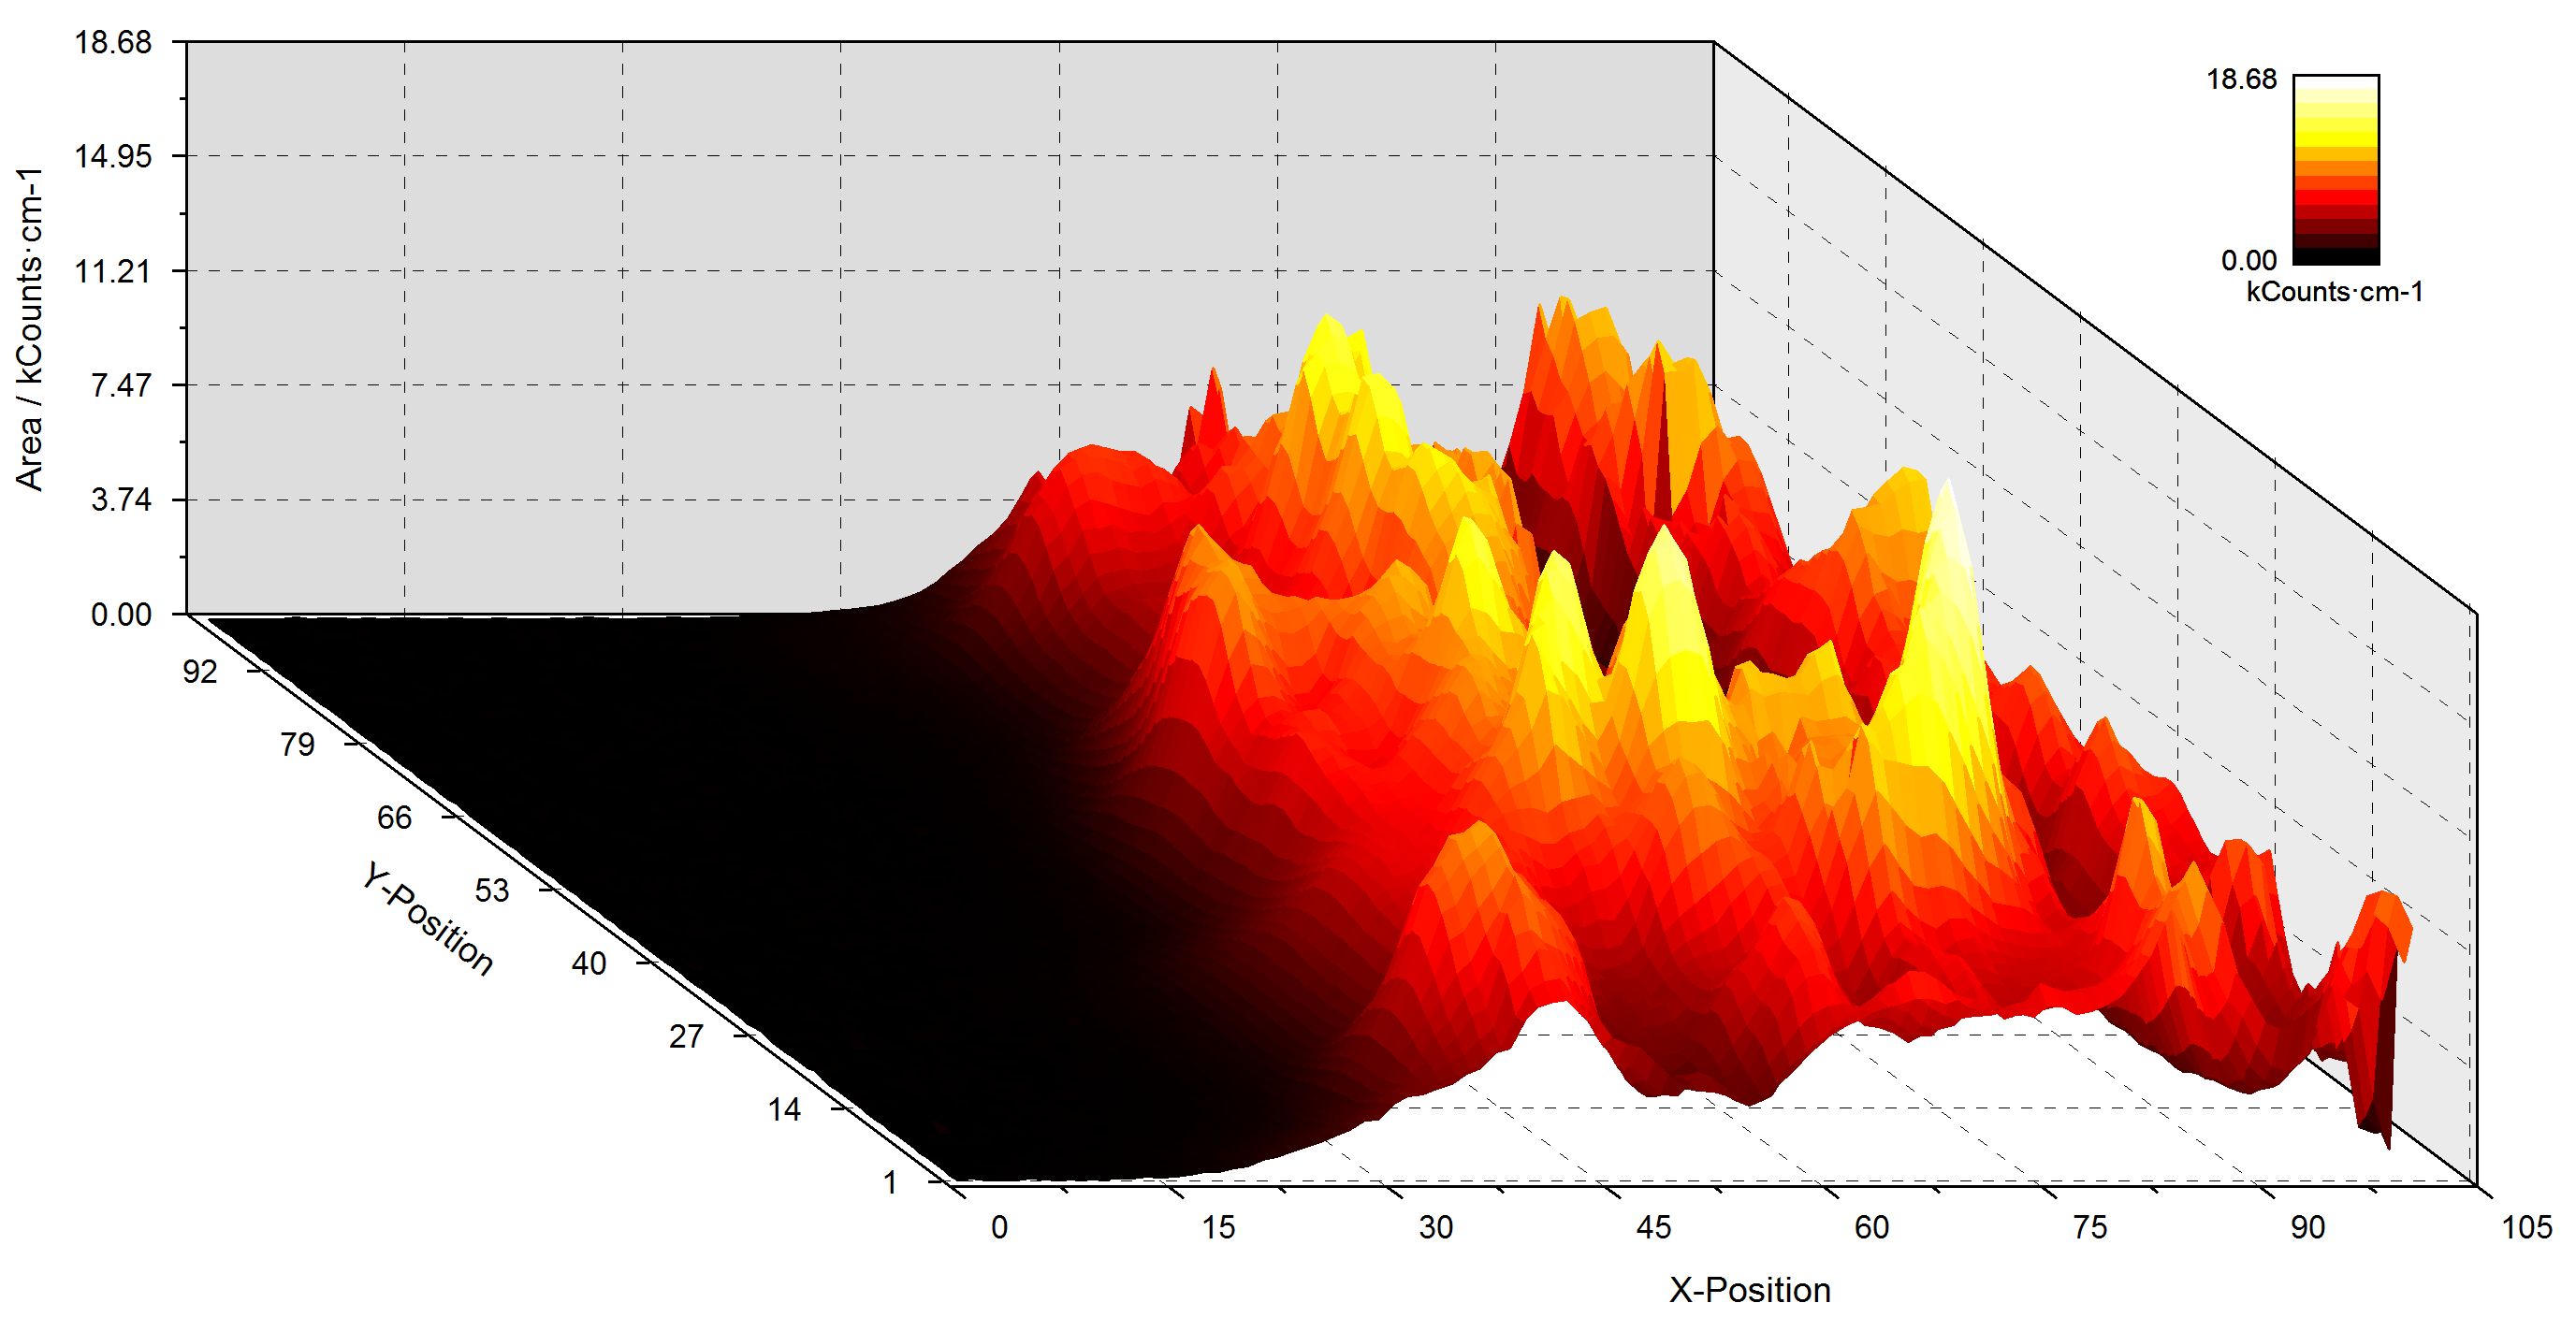
3. 3D Waterfall 0 Degree
4. 3D Waterfall 0 Degree Plus
5. 3D Waterfall 45 Degree
6. 3D Waterfall -45 Degree
7. 3D Colour Profile
8. XY 3D Plot 45 Degree
9. XY 3D Plot -45 Degree
10. XY 3D Colour Profile
11. XY 3D 45 Degree
Colour Profile
12. XY 3D -45 Degree
Colour Profile
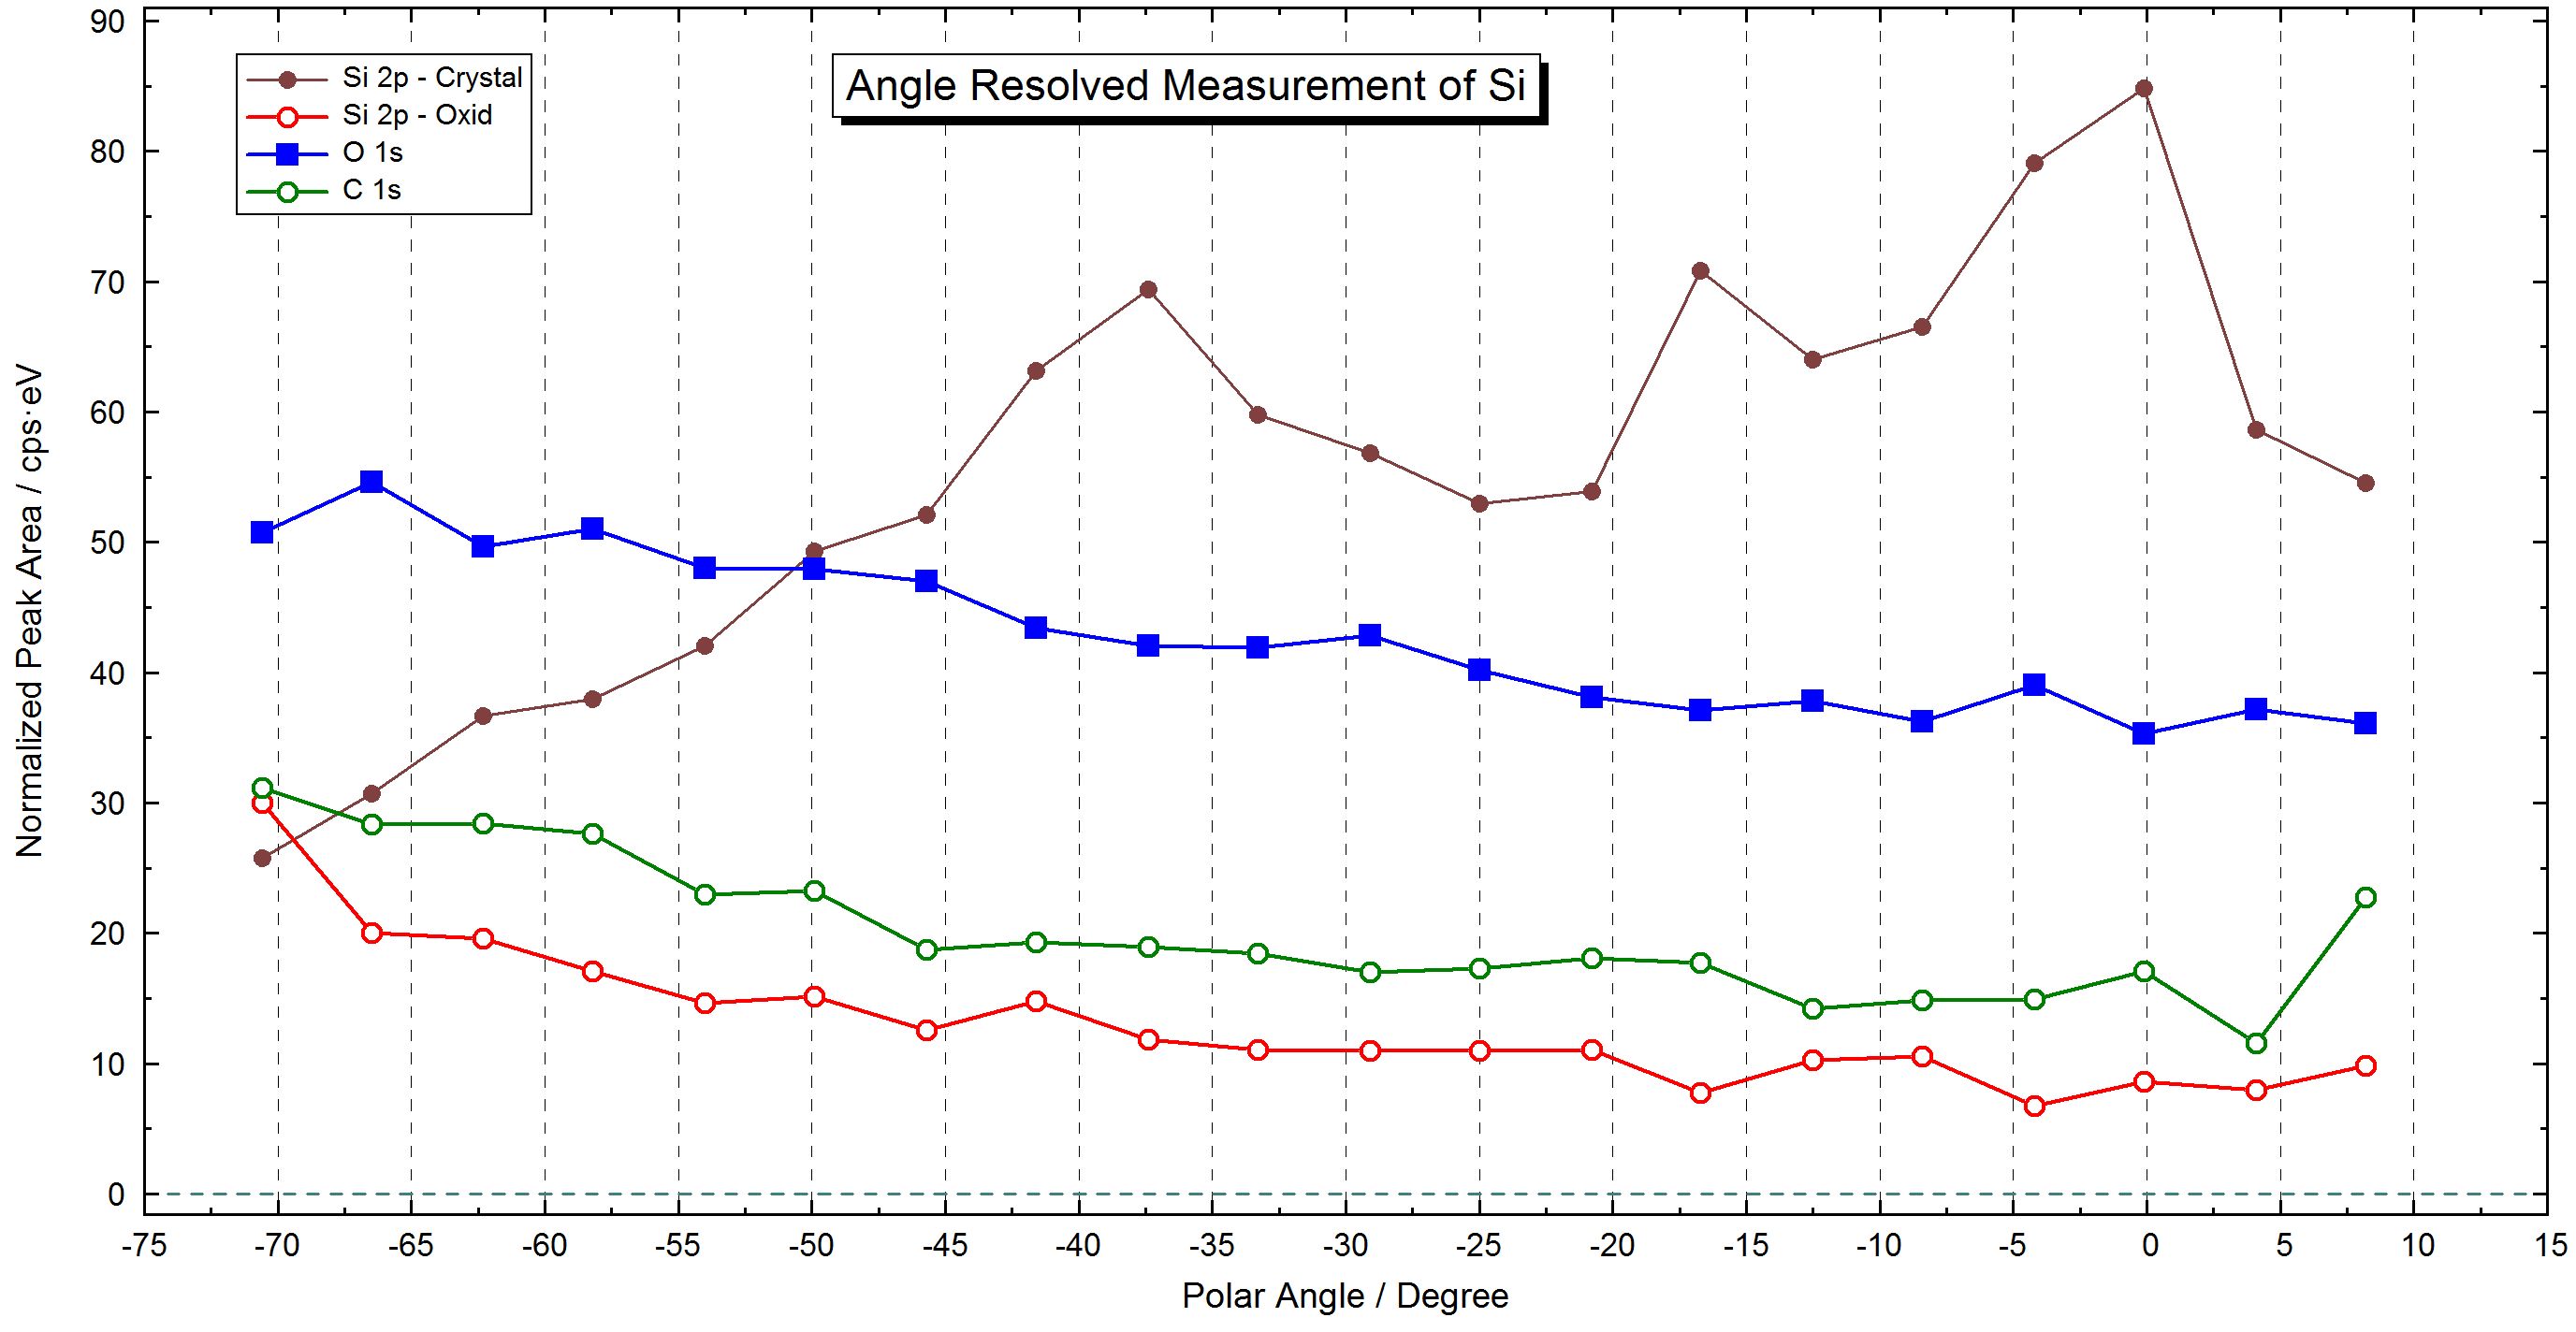
13. Parameter Plot
14. Windows Video Sequence
|
1. Survey, N1s_fitted_spectrum
2. As3d+AsLMM_Wagnerplot
3. Pyridine+Pt_3D_Waterfall_0
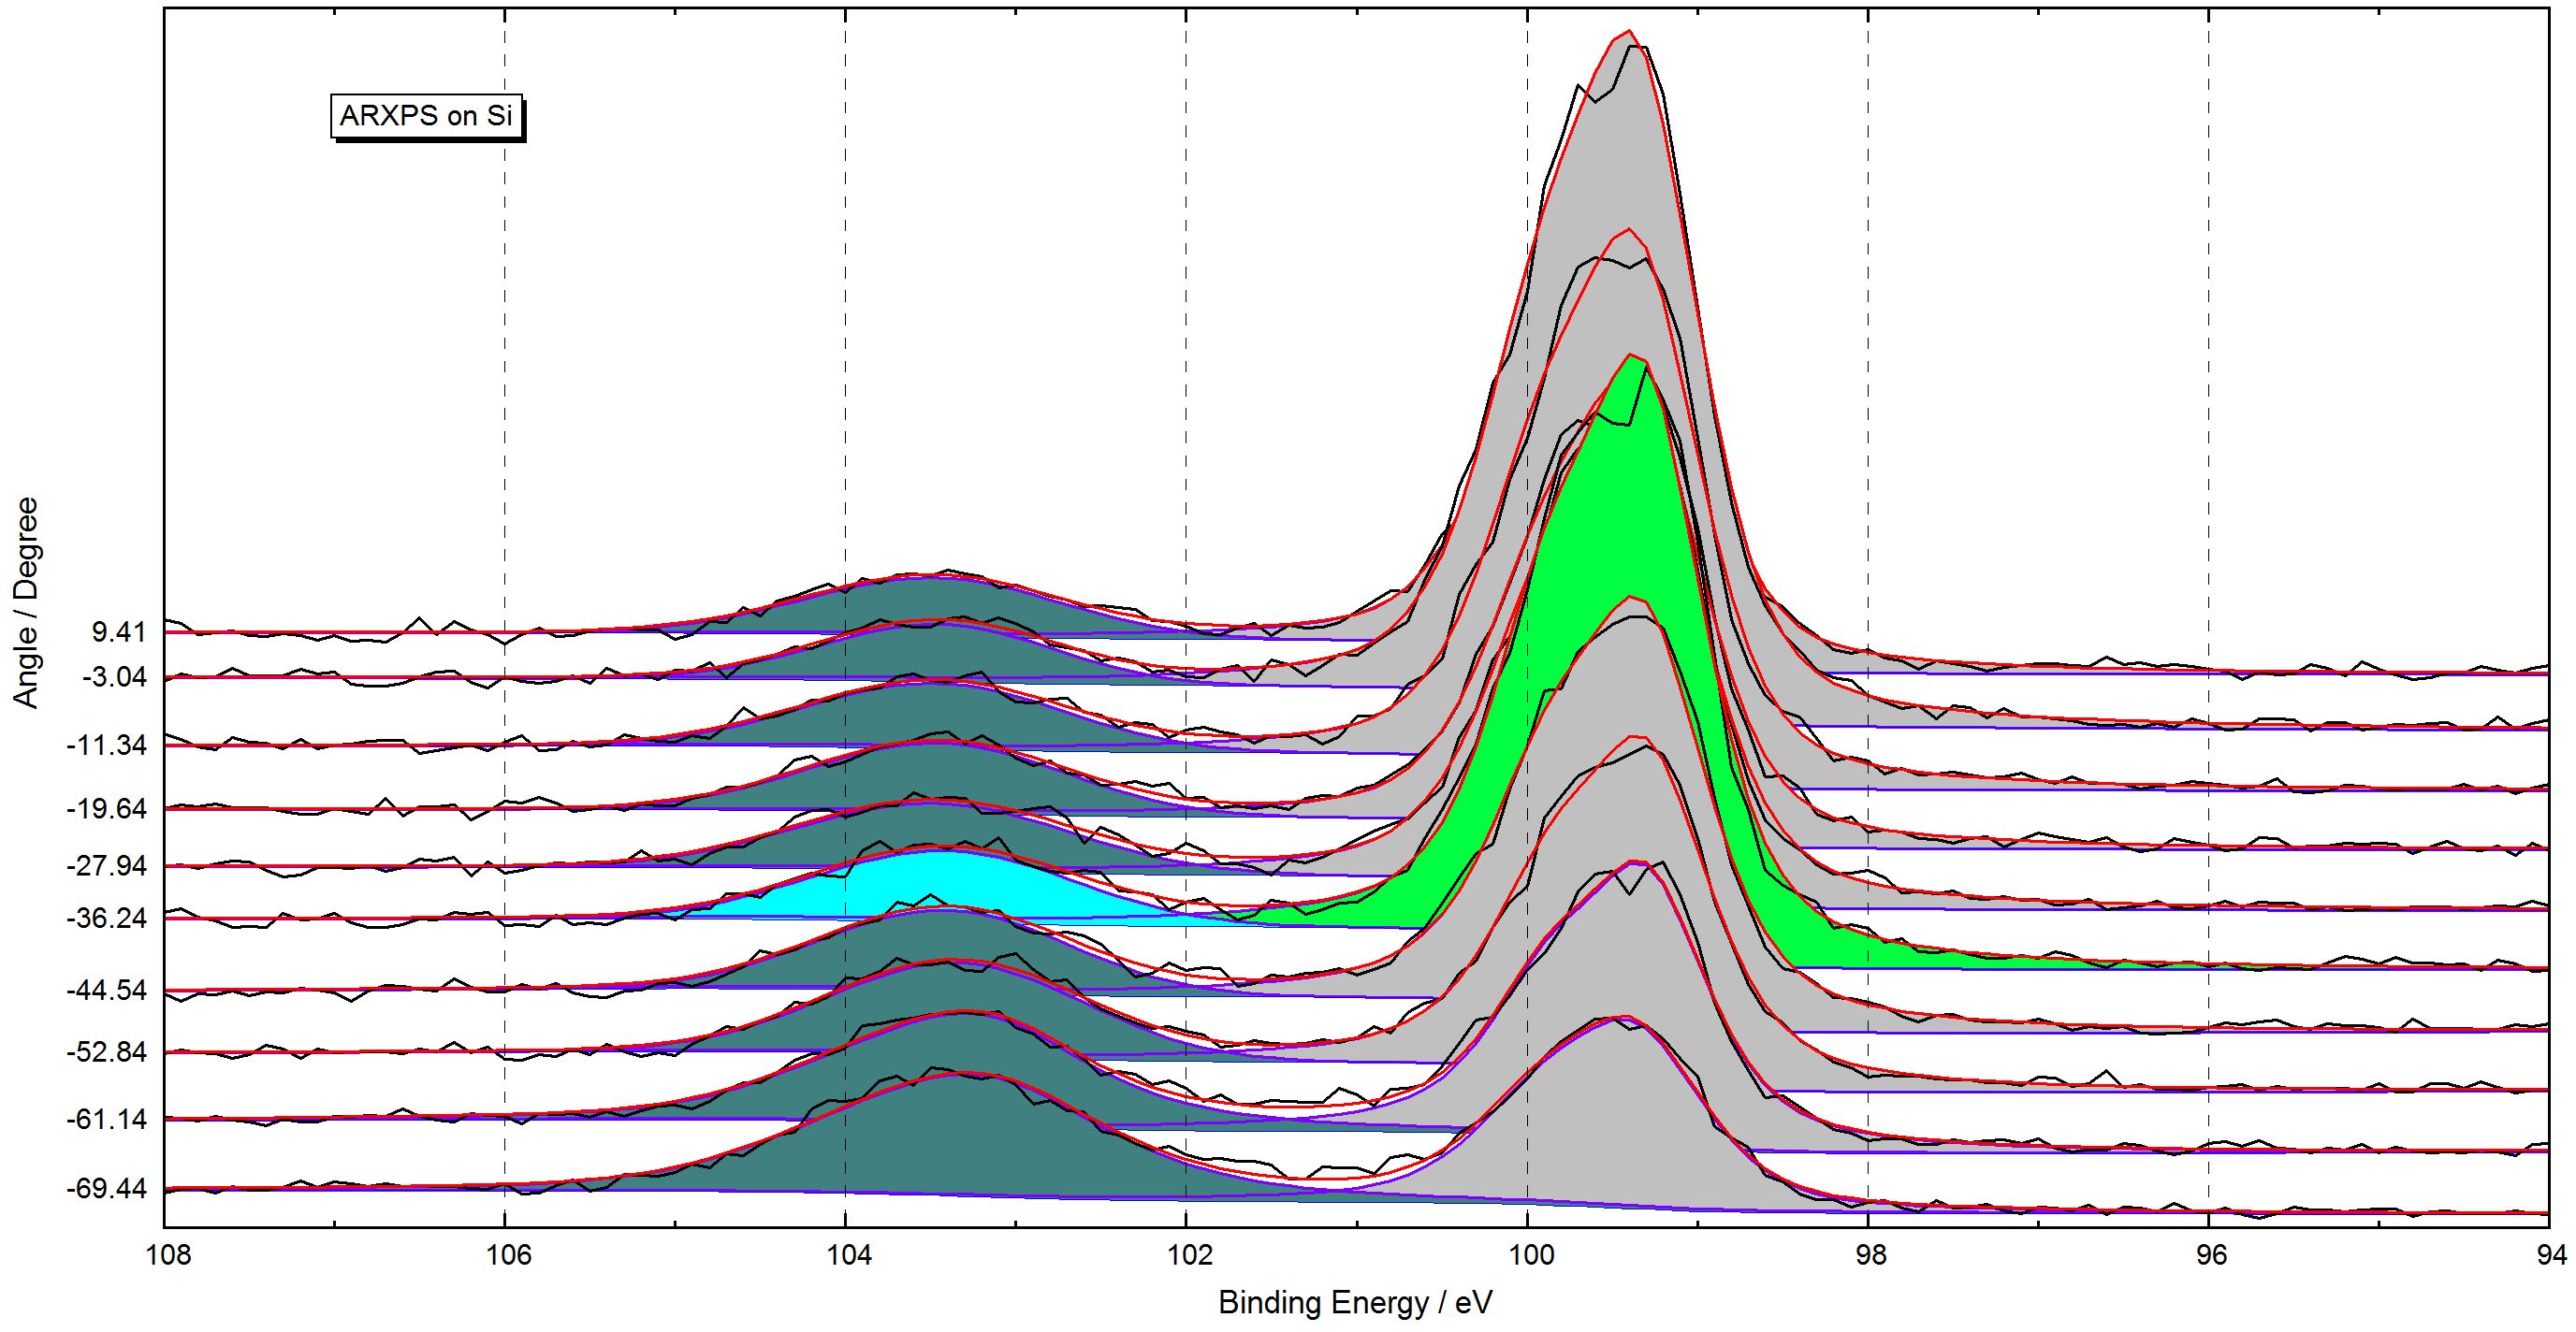
4. ARXPS_Si_3D_Waterfall_0_Plus
5. Pyridine+Pt_3D_Waterfall_45
6. Pyridine+Pt_3D_Waterfall_-45
7. Pyridine+Pt_3D_Colour_Profile
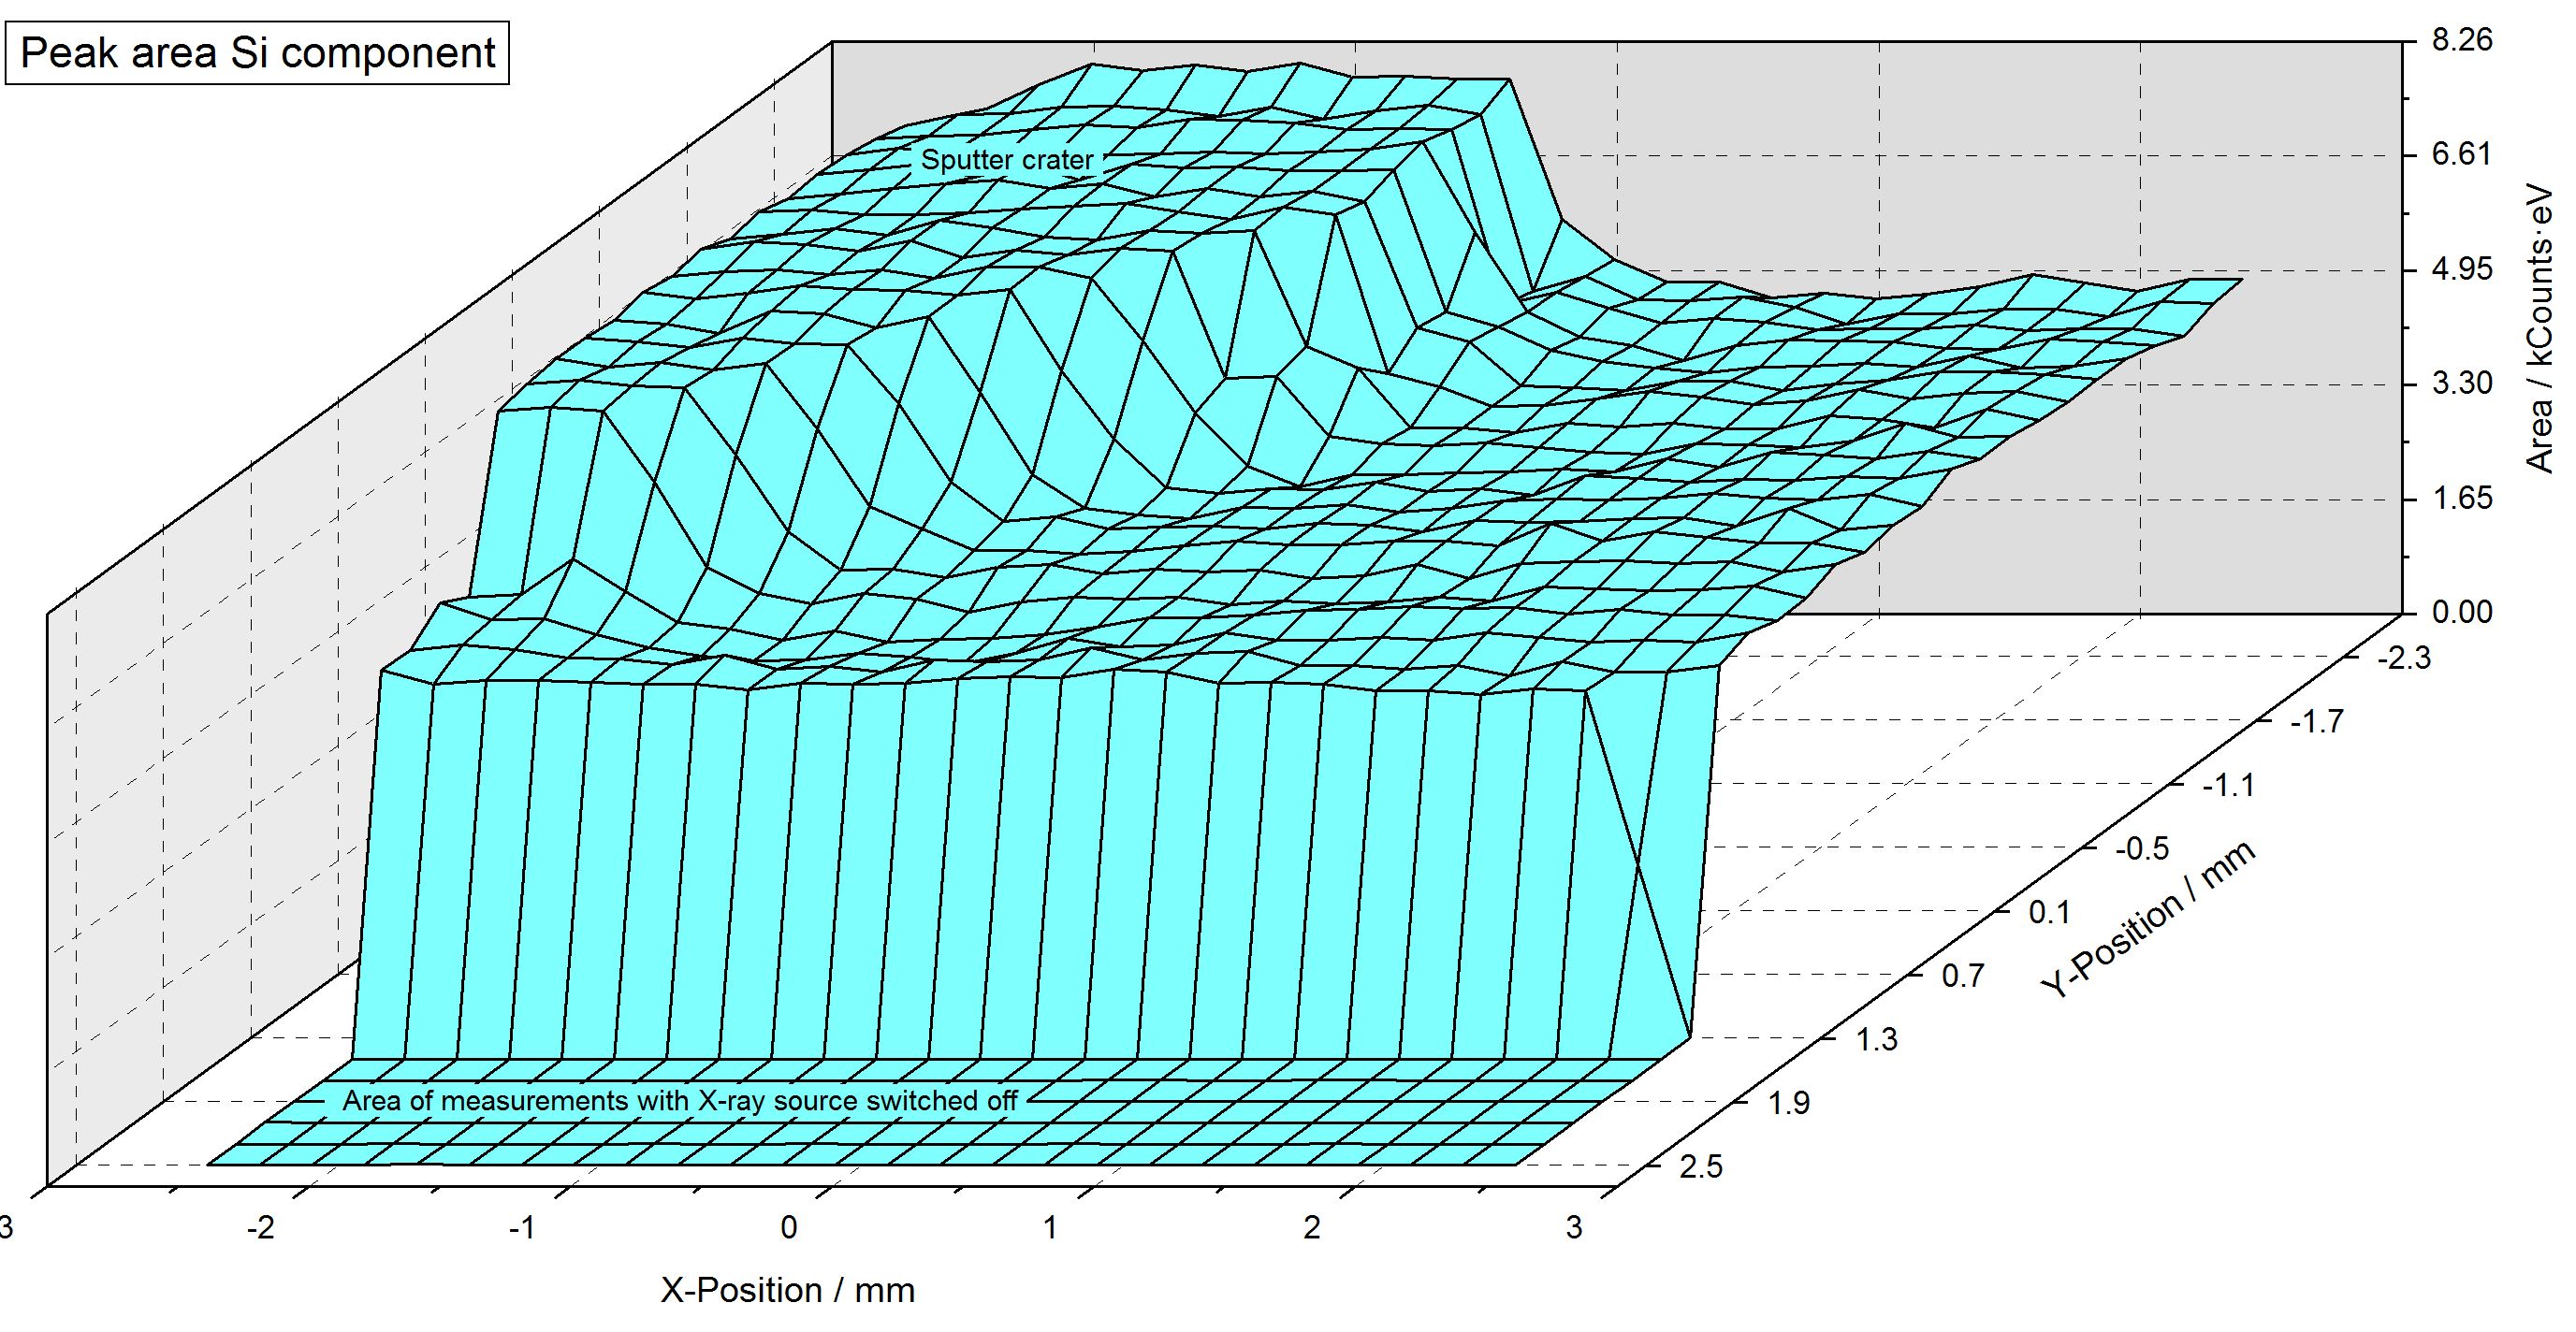
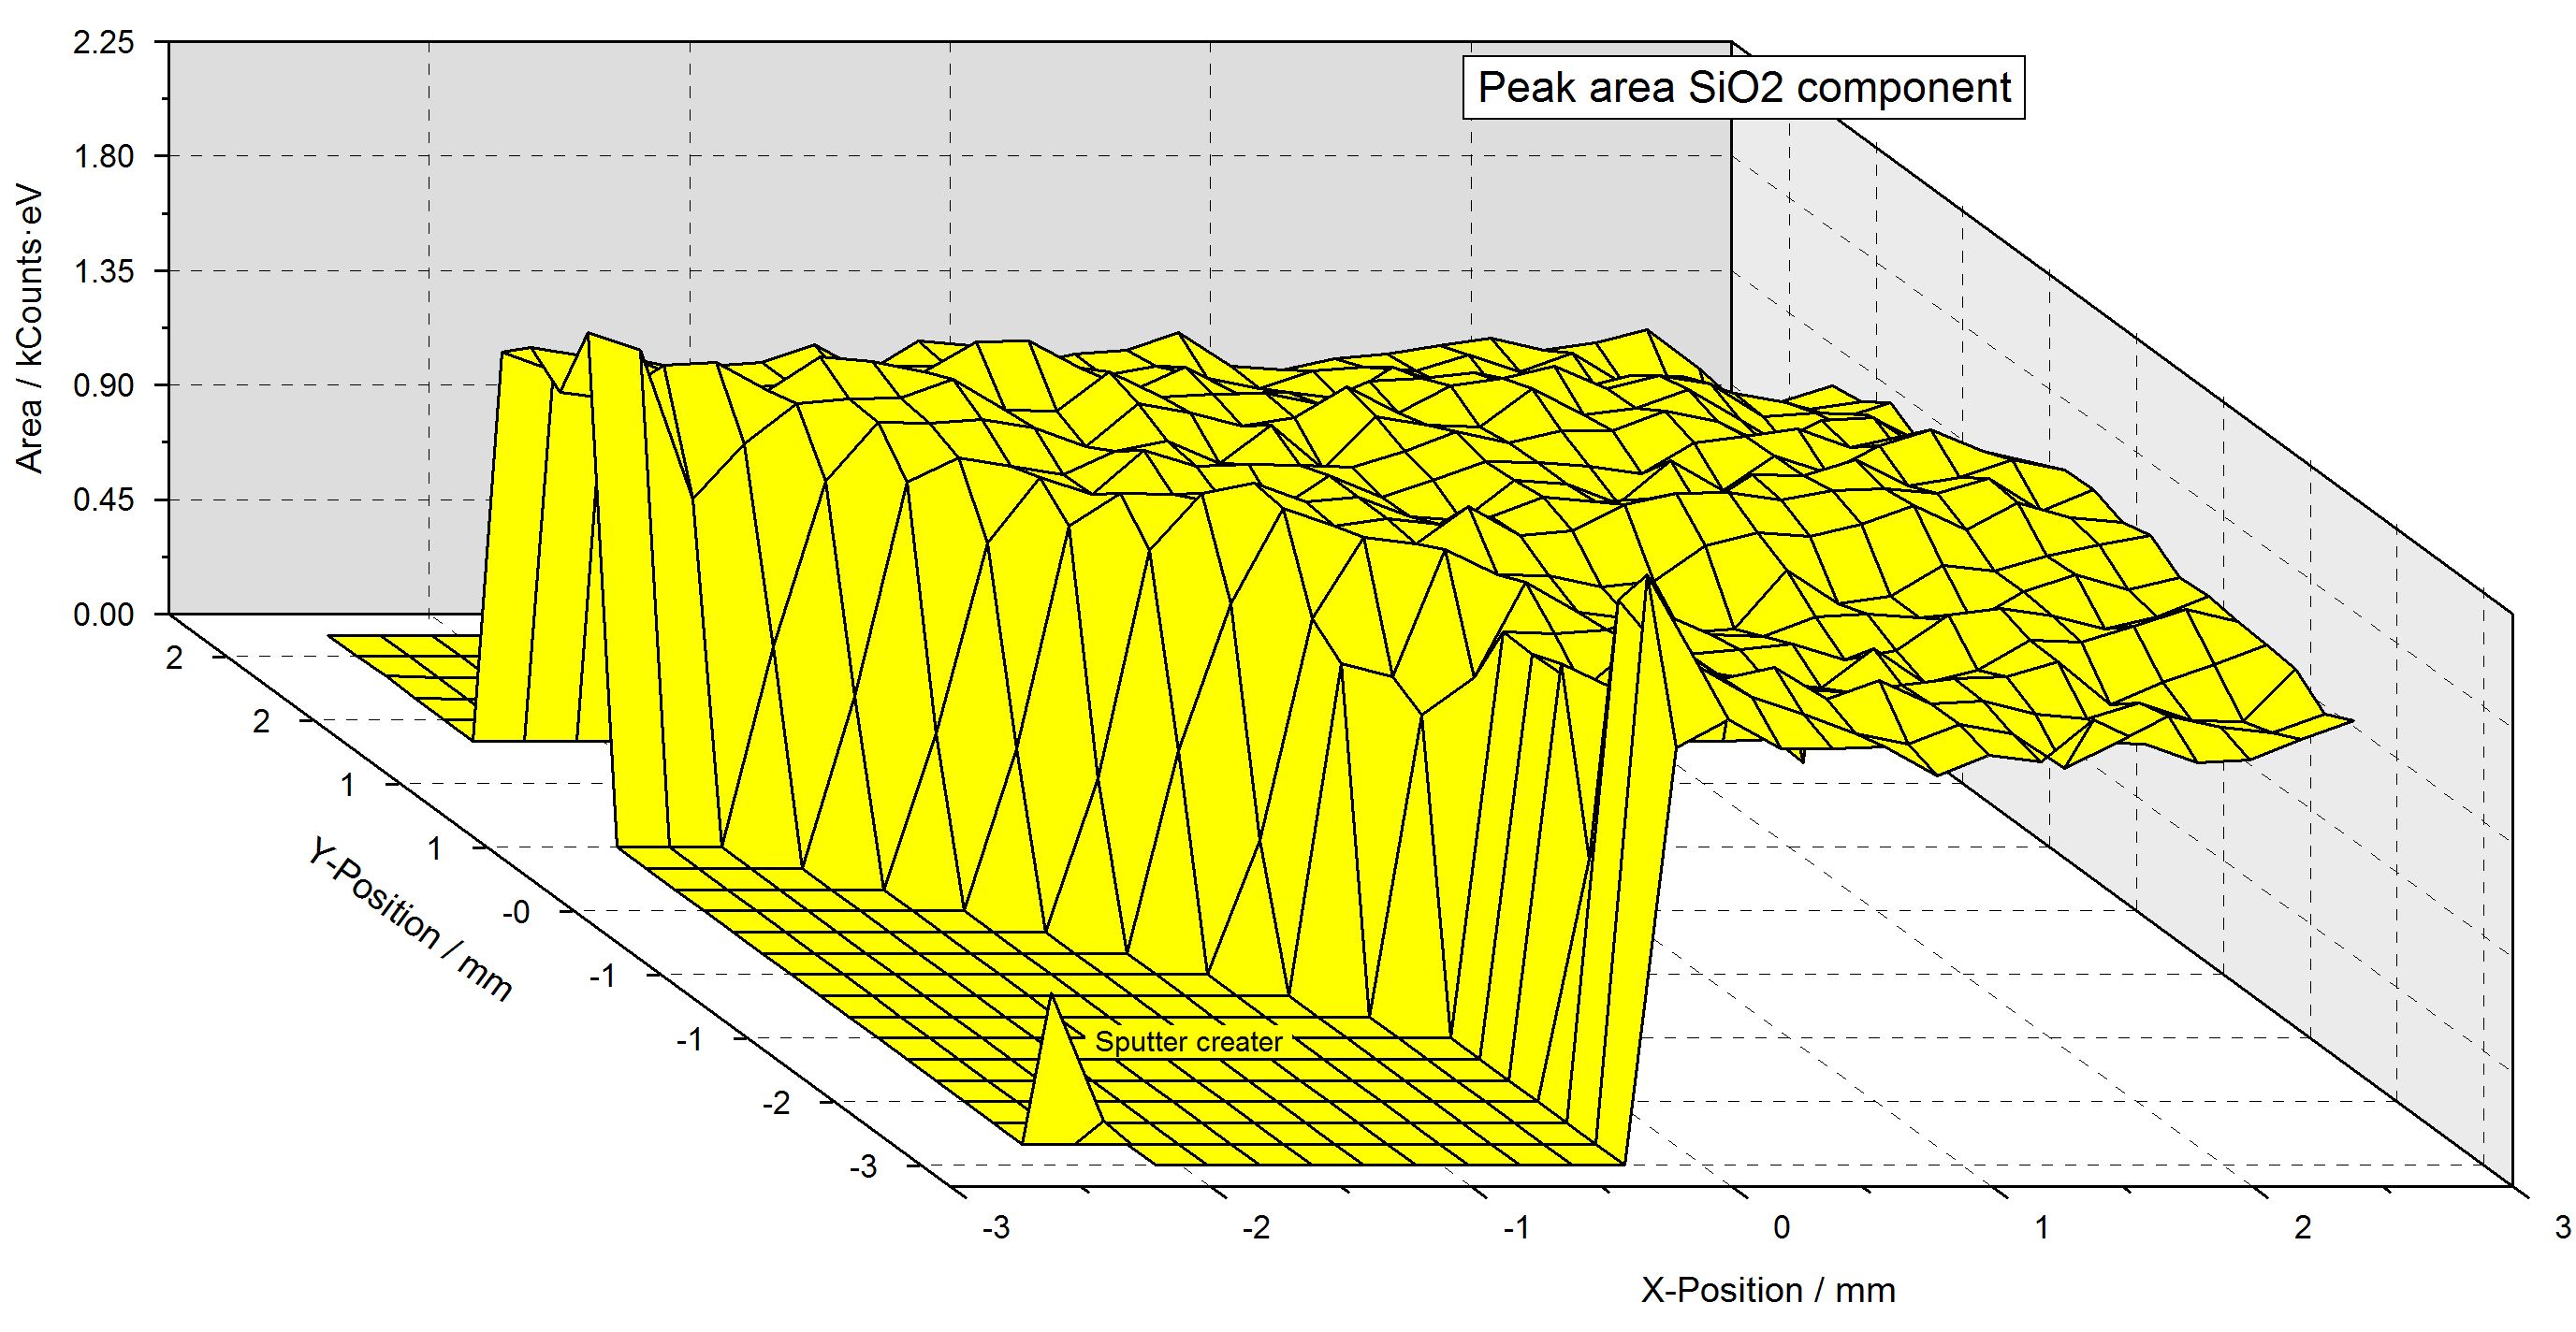
8. Sputter_Crater_Si_XY_3D_Plot_45
9. Sputter_Crater_Si_XY_3D_Plot_-45
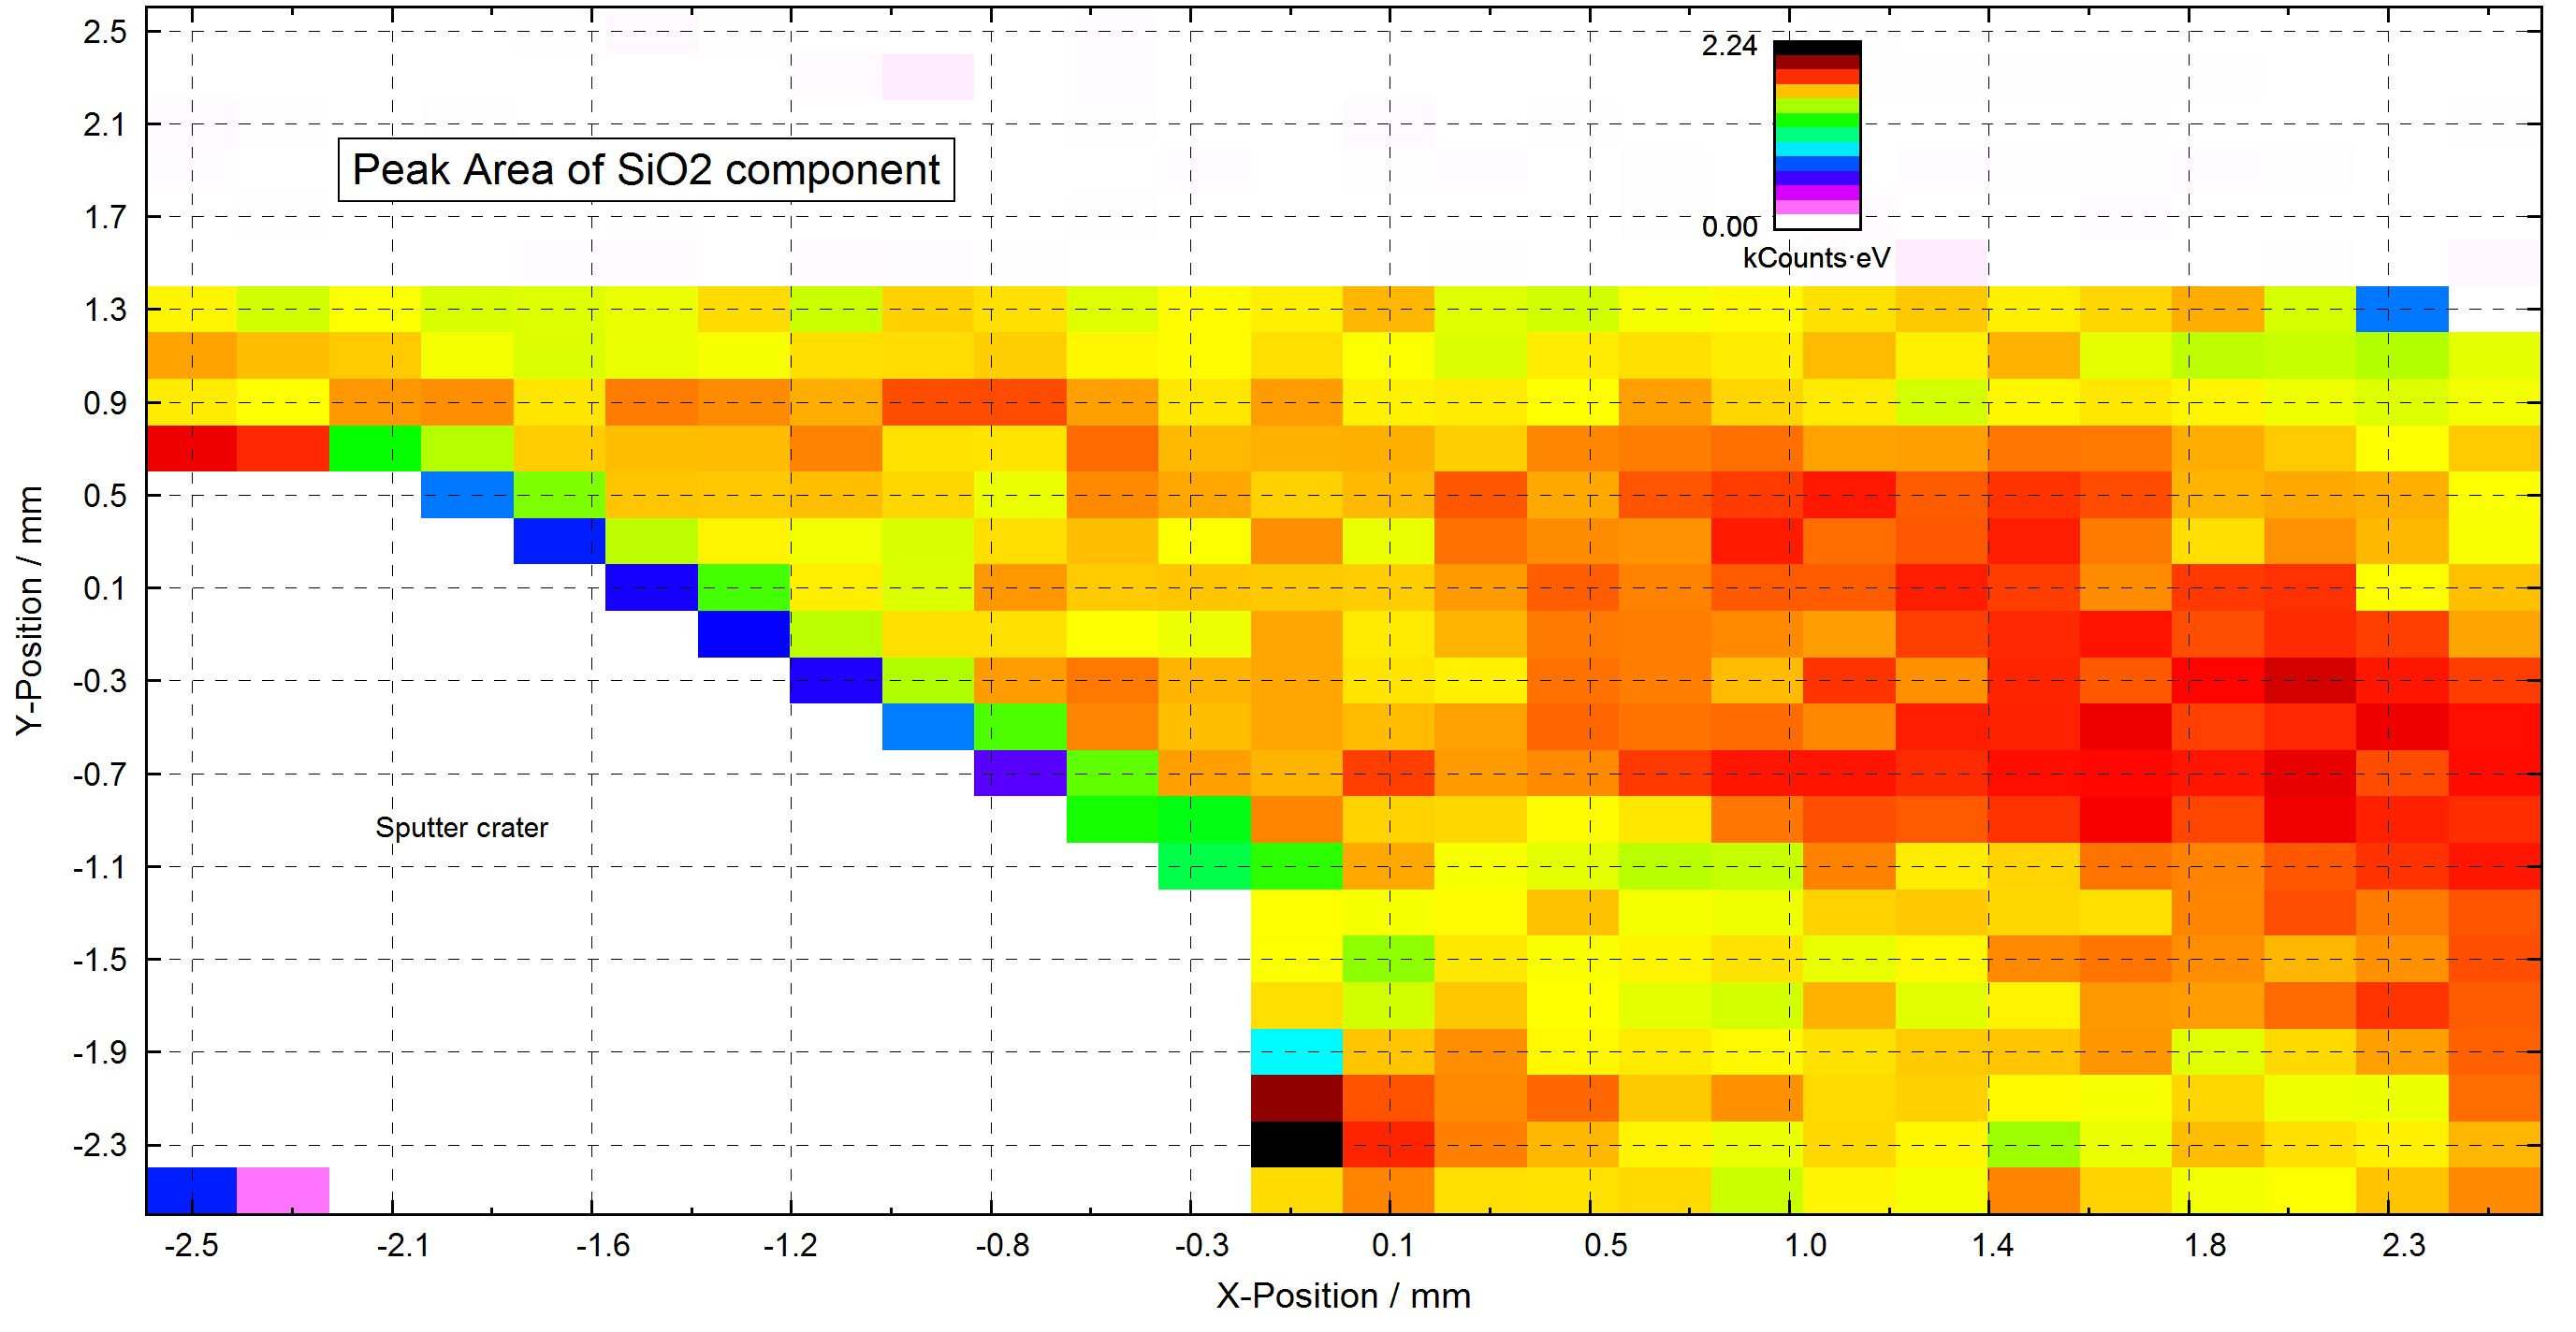
10. Sputter_Crater_Si_XY_3D_Colour
11. RAMAN_Si_Mapping_101x101_
XY_3D_45_Colour_Profile
12. RAMAN_Si_Mapping_101x101
XY_3D_-45_Colour_Profile
13. ARXPS_Si_Parameter_Plot |
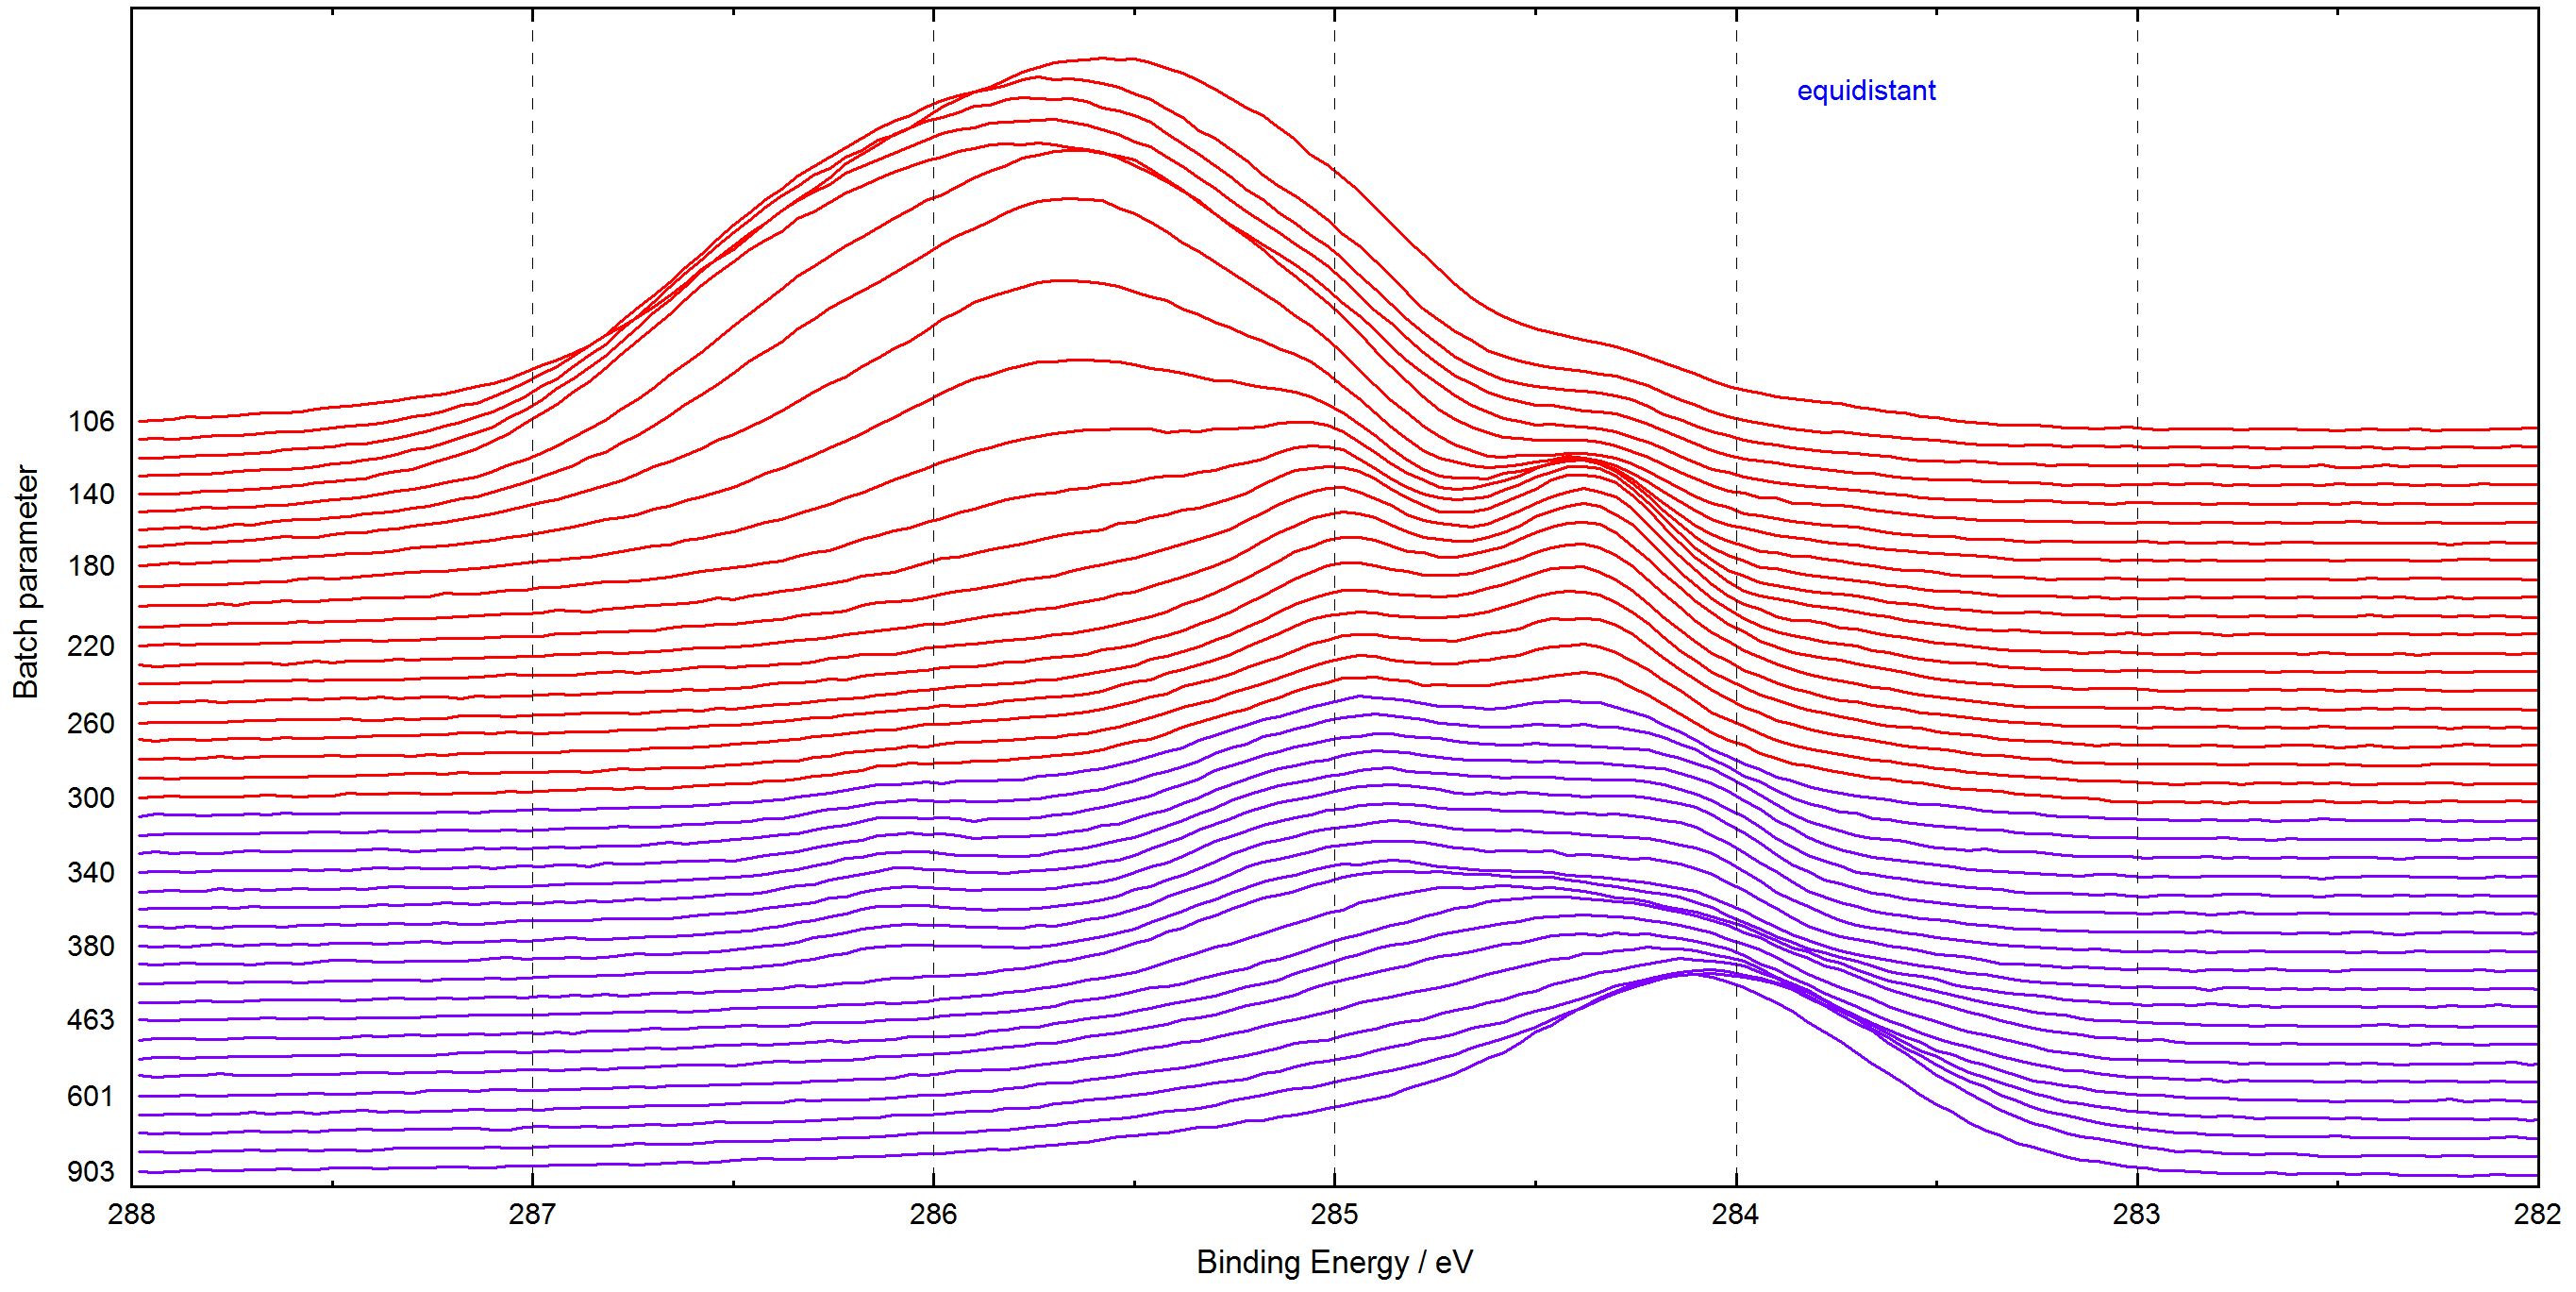
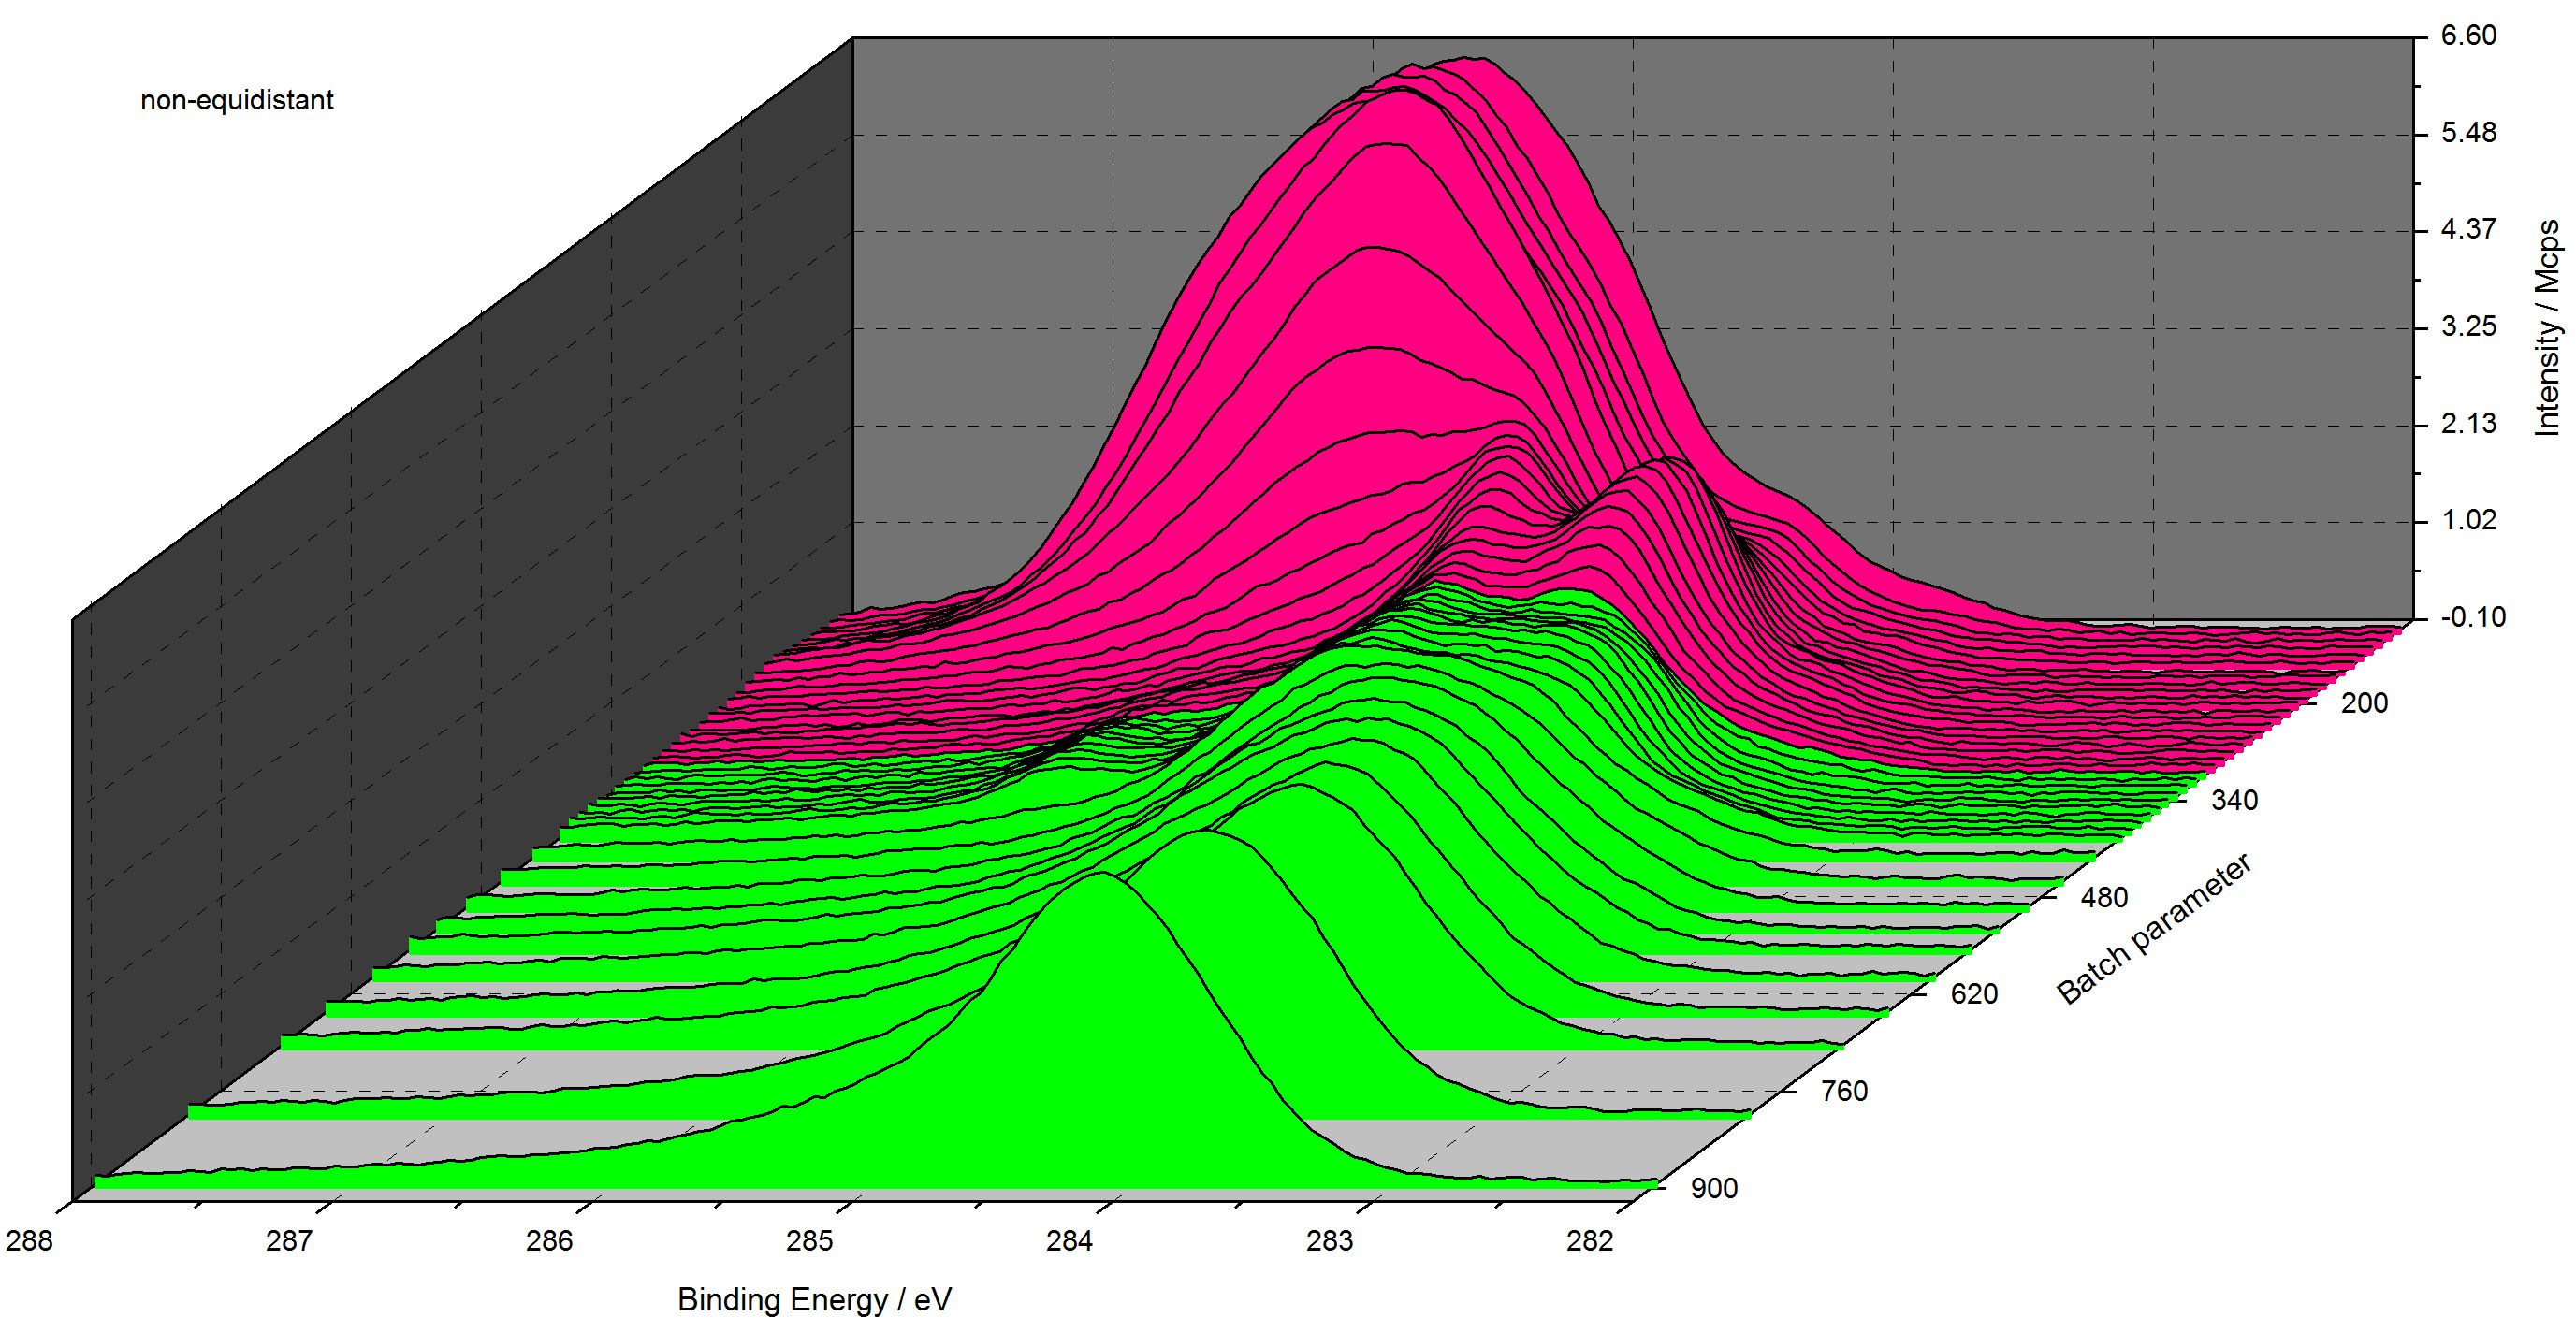
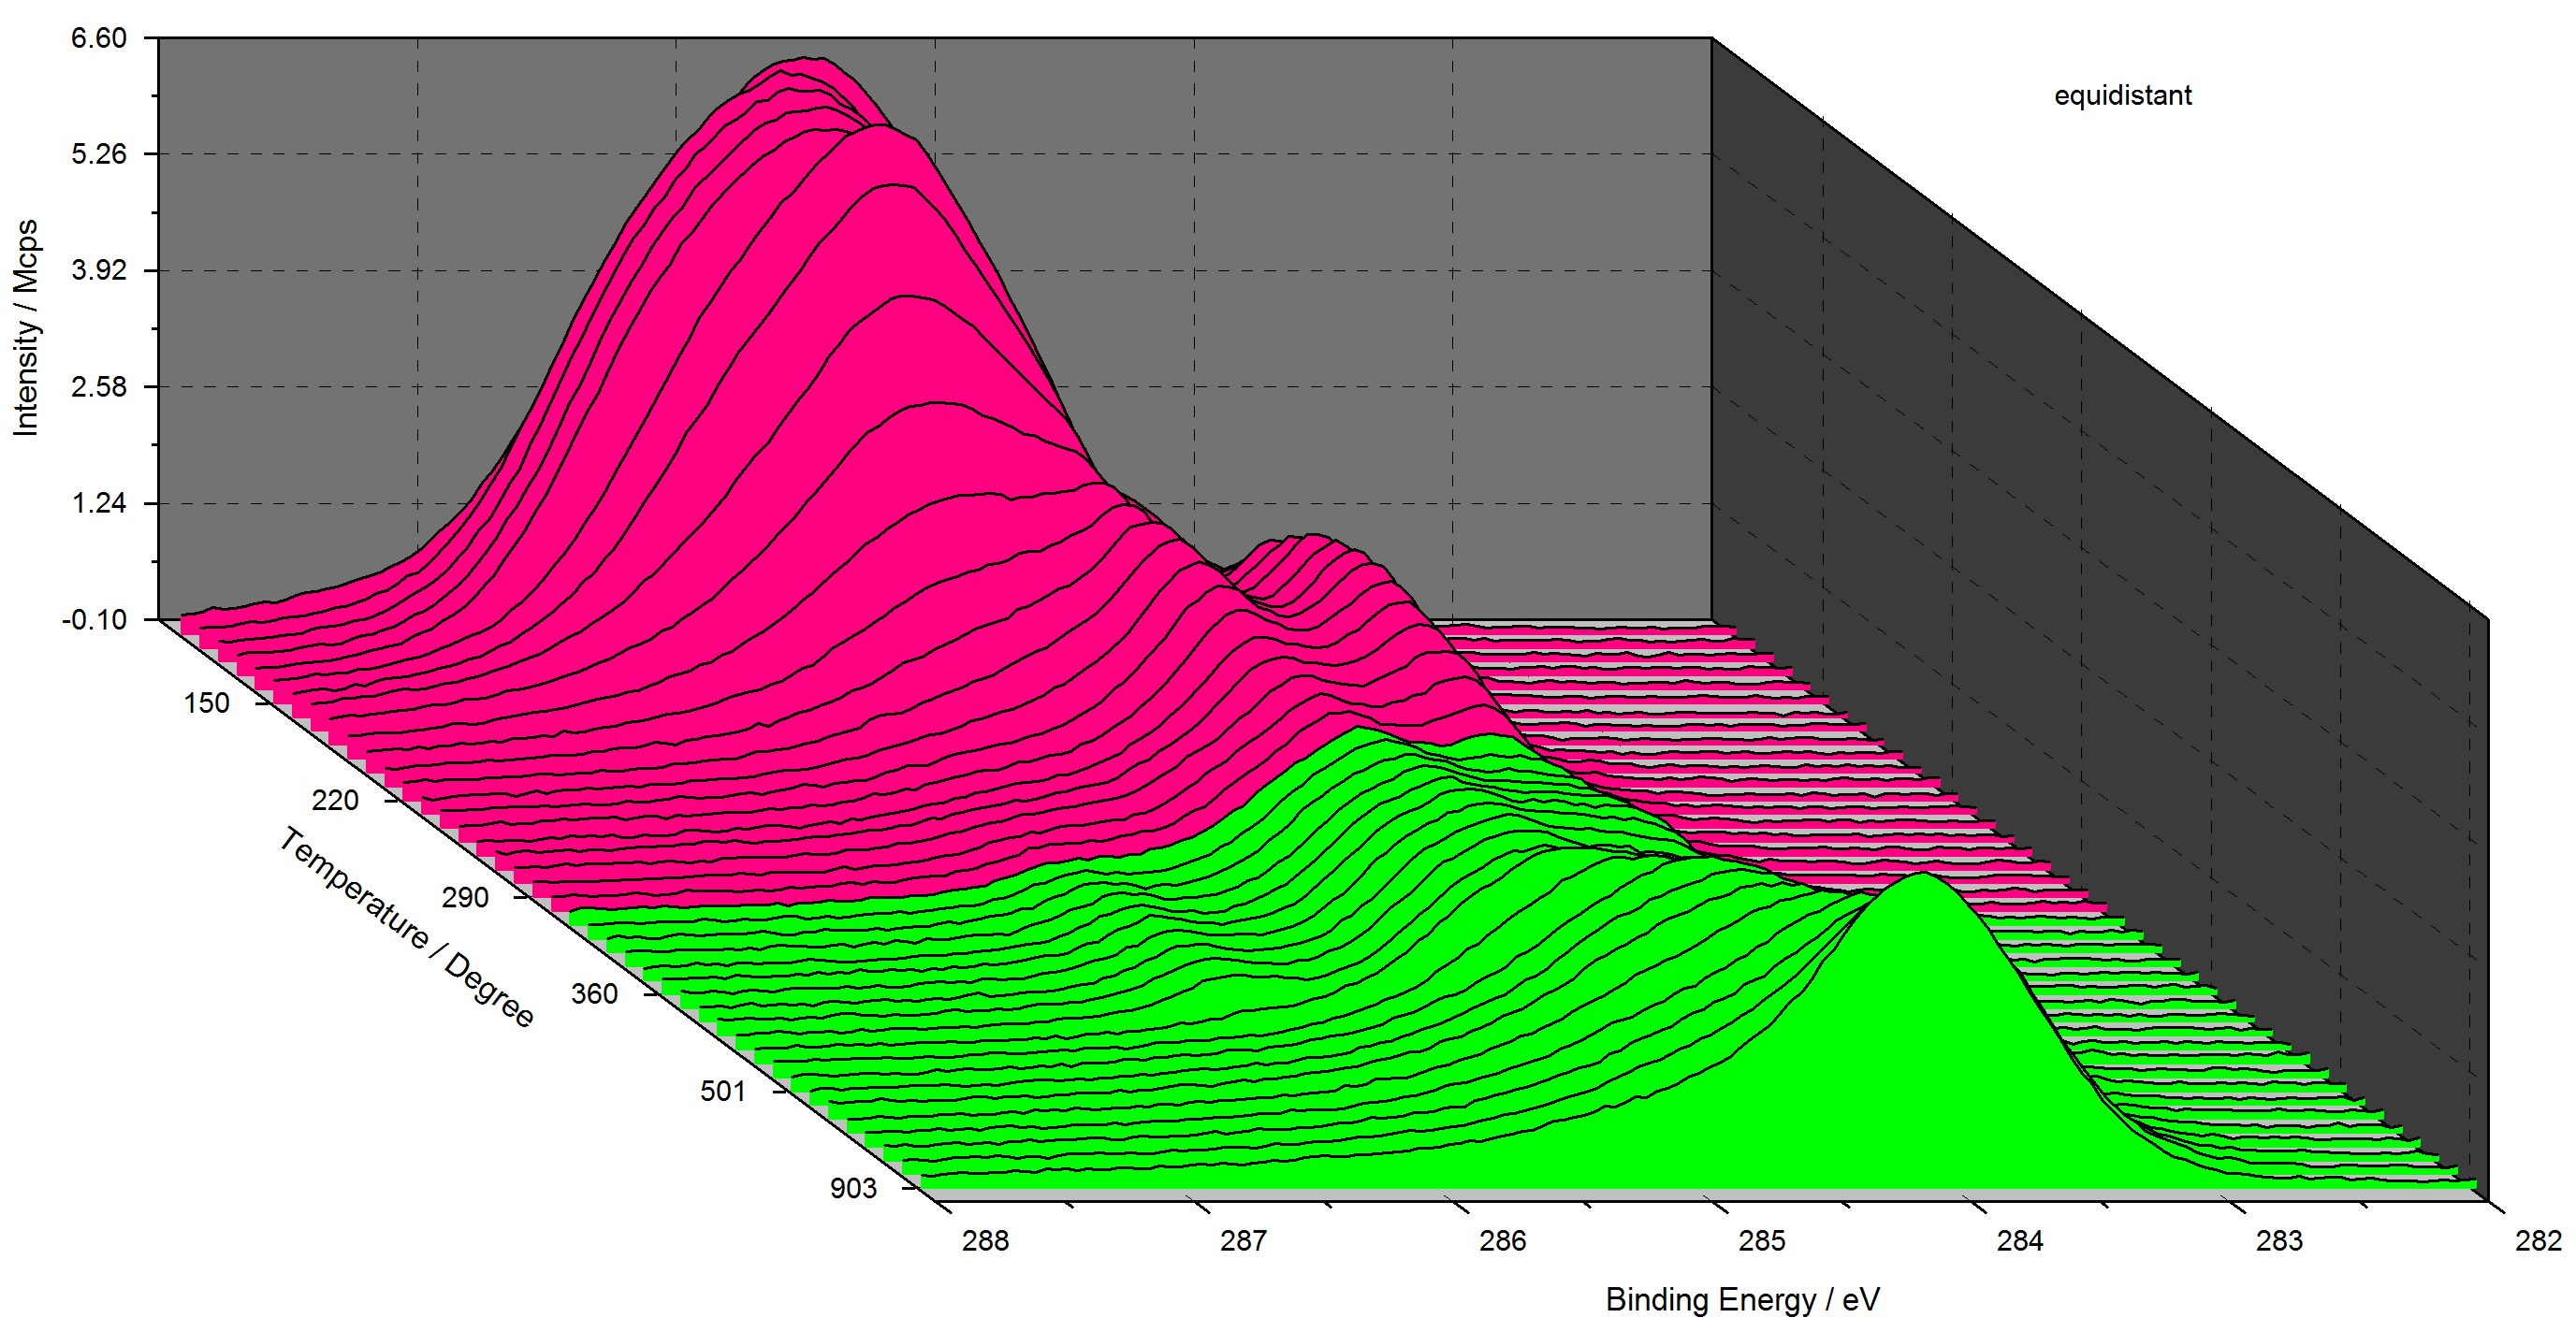
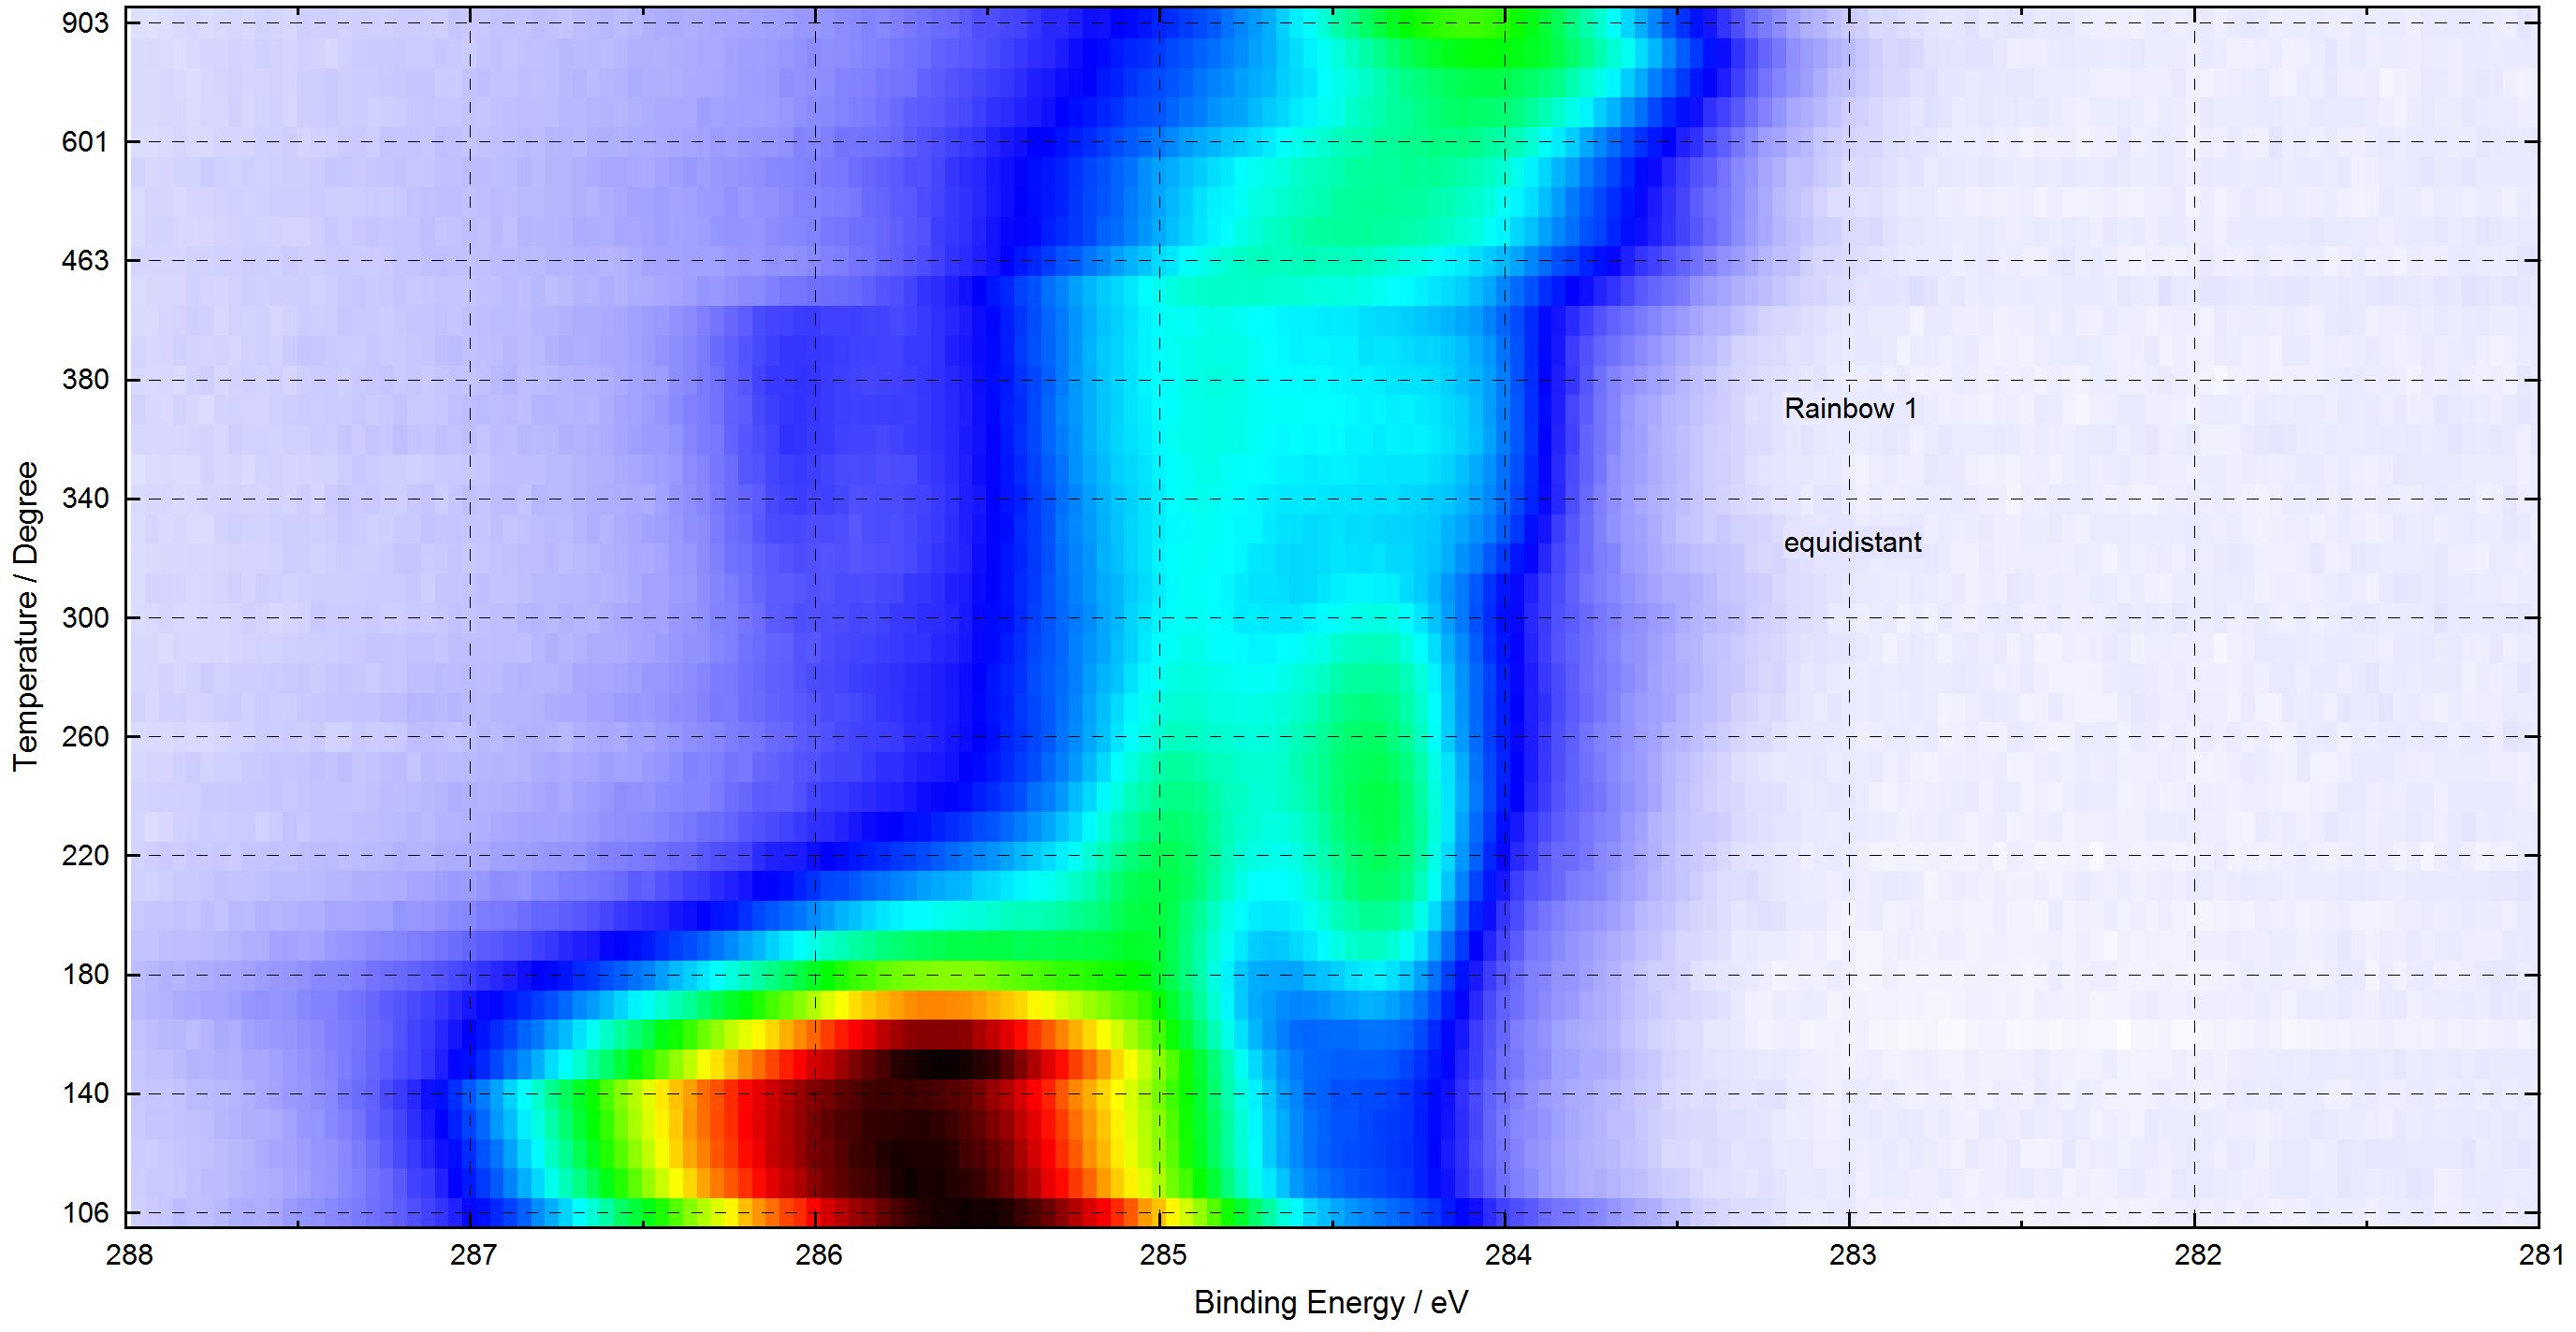
My special measurement
format has not equidistant
step widths. Can UNIFIT read that data format? |
Yes, UNIFIT can read these
special data formats. An internal
subroutine convert the data in an
format with equidistant step
widths using linear interpolation.
|
1. Measurement data files of XAS
(x-axis: Photon energy/eV)
2. Measurmenet data files of RAMAN spectroscopy
(x-axis: Wave number/cm-1)
|
How many main memory
can UNIFIT handle?. |
UNIFIT is a 32-bit software. The activation of the 'Large Address Set' allows UNIFIT the using of about 3500 MBytes main memory. |
|
| How many spectra can UNIFIT load and parallel handle using the batch processing routine? |
UNIFIT can read more than 75000 spectra. The batch processing
can use all loaded spectra. |
|
| Which spectroscopic methodes supports UNIFIT? |
UNIFIT supports four
spectroscopic methods:
XPS, AES, XAS and RAMAN spectroscopy.
Multiregion, multipoint and batch-processing measurements (ARXPS, SDP,...) can be loaded. |
|
| What is the price of the UNIFIT software? |
We offer four different versions
and three different licences
(single licence, research group
licence, site licence).
Universities and colleges get a
30%-discount (educational
discount). If you wish to get
a price list please send
an e-mail to:
unifit-software@t-online.de
|
|
My special measurement data format is not readable
using the UNIFIT software? |
If you order the software than
your special data format will be
implemented in the input routine
of the UNIFIT software
without of
extra charge. Please
send
typical measurement files as
attachment to:
unifit-software@t-online.de |
Please find the list of supported data formats on this website - column:
Supported Spectrometers
or book 'Line Positions and Data Formats' on this website - column:
Manual |
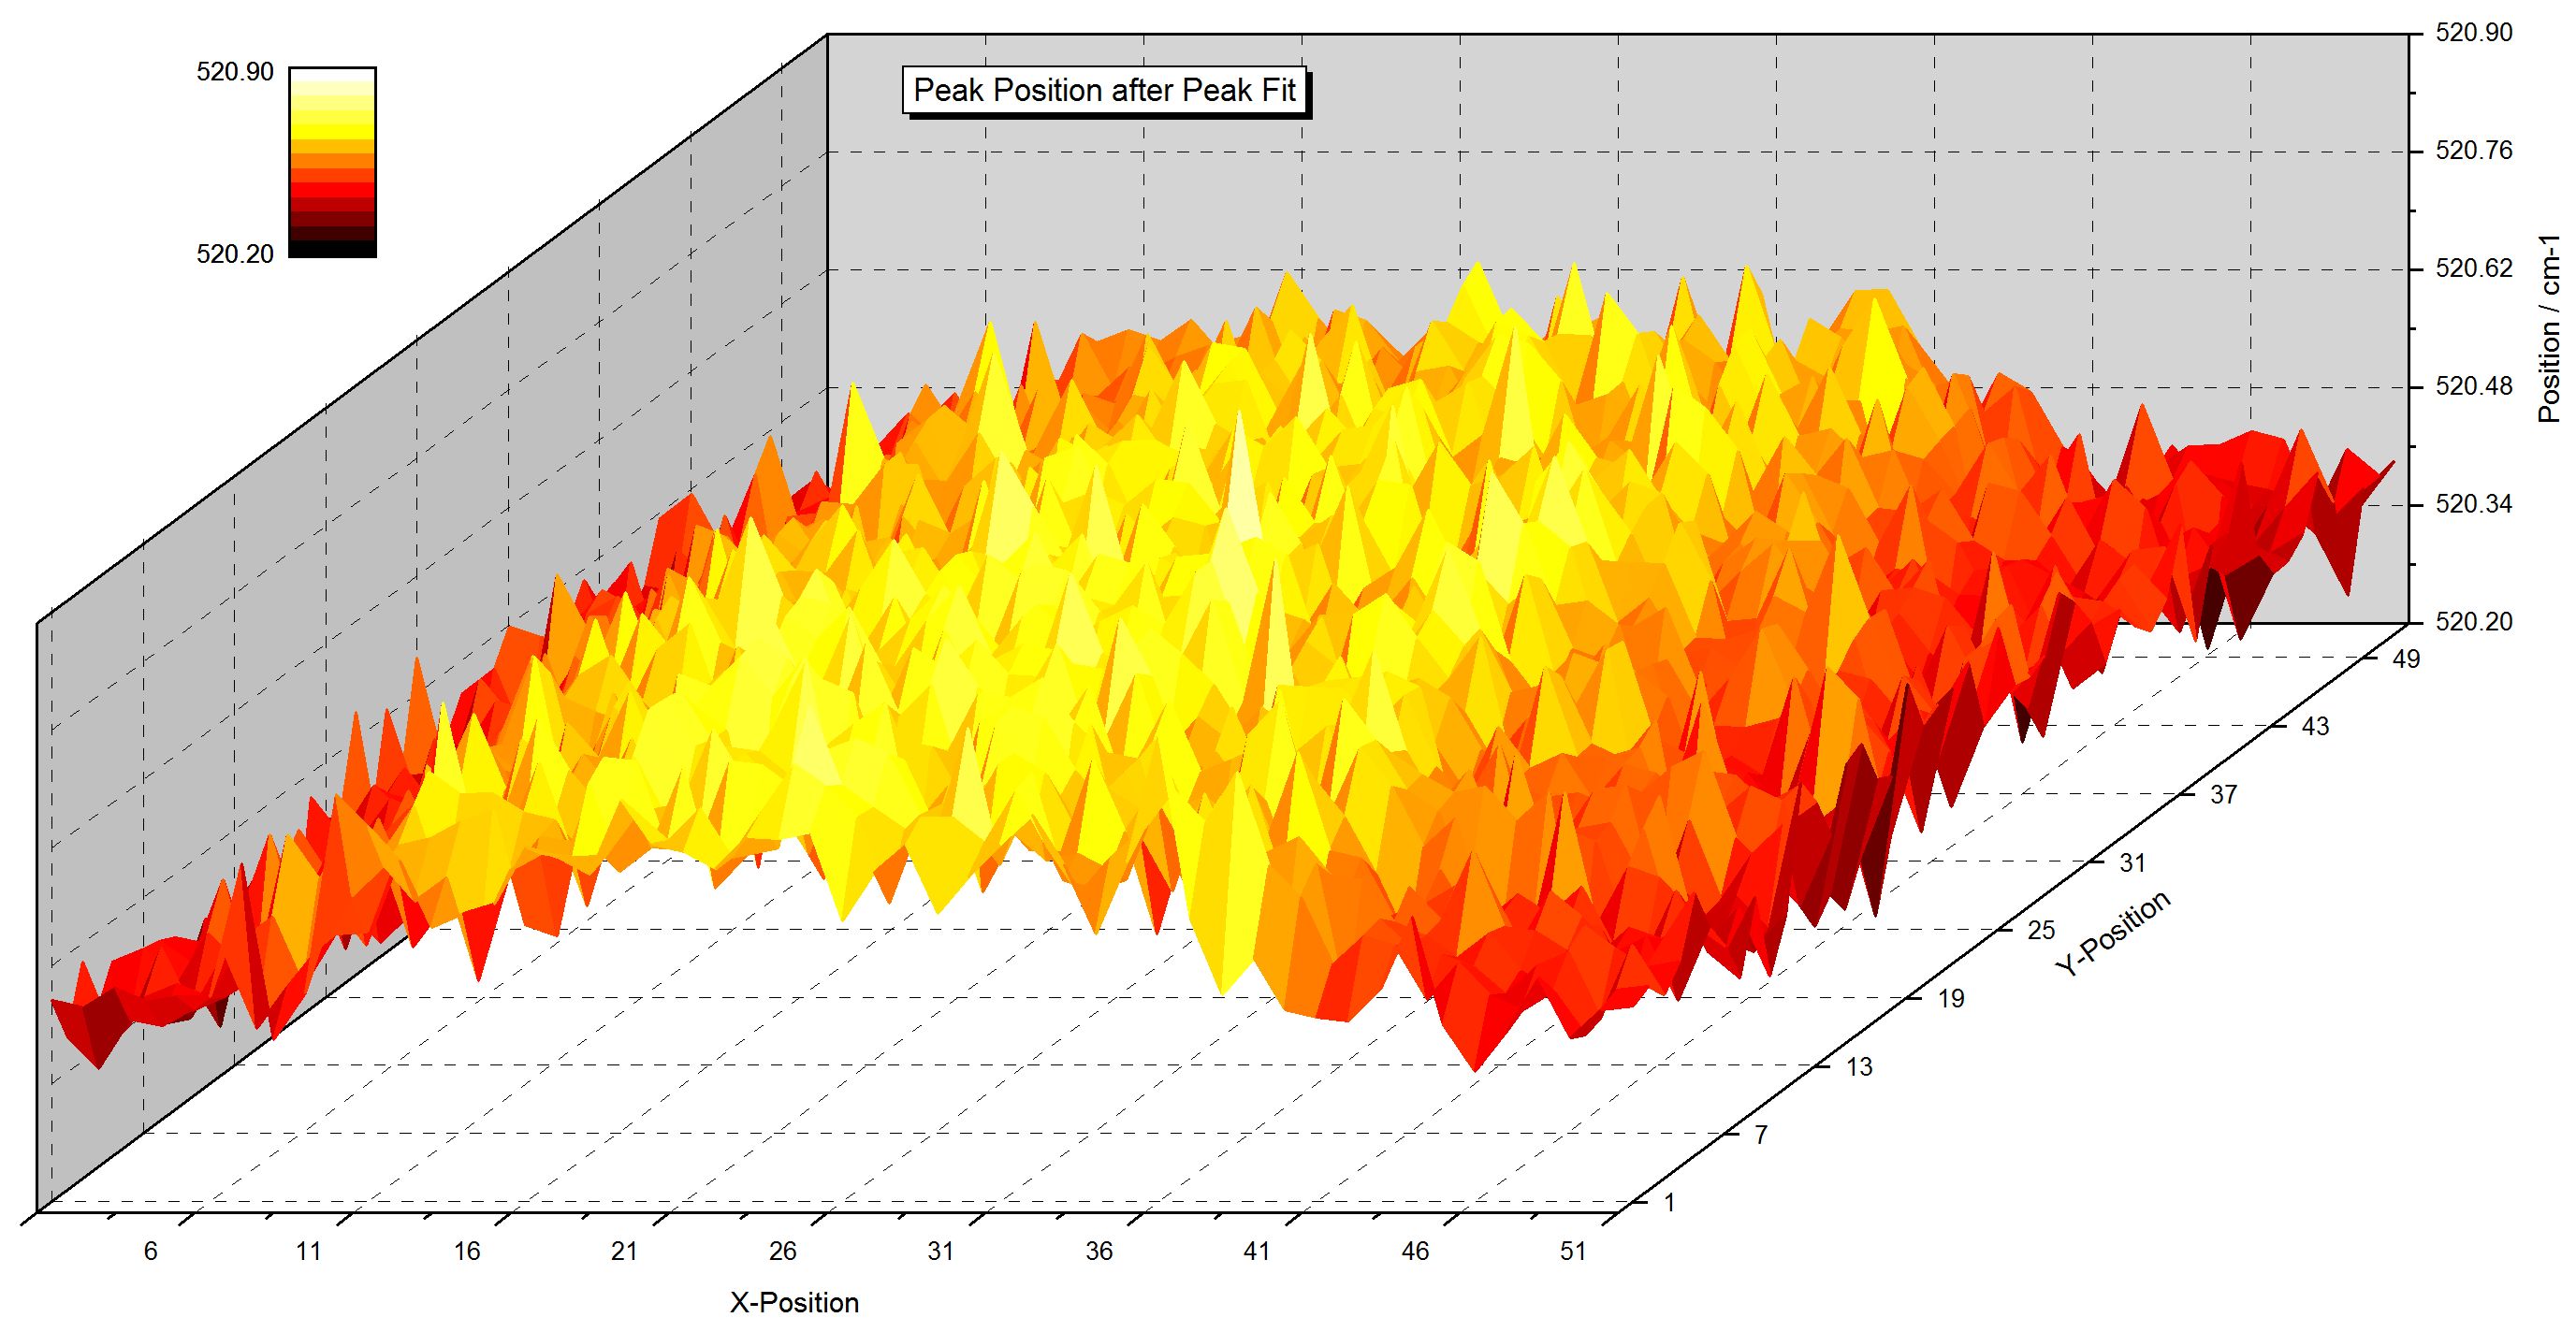
What is the advantage of
peak fittting of RAMAN
spectra for the
estimation
of peak positions
(wave
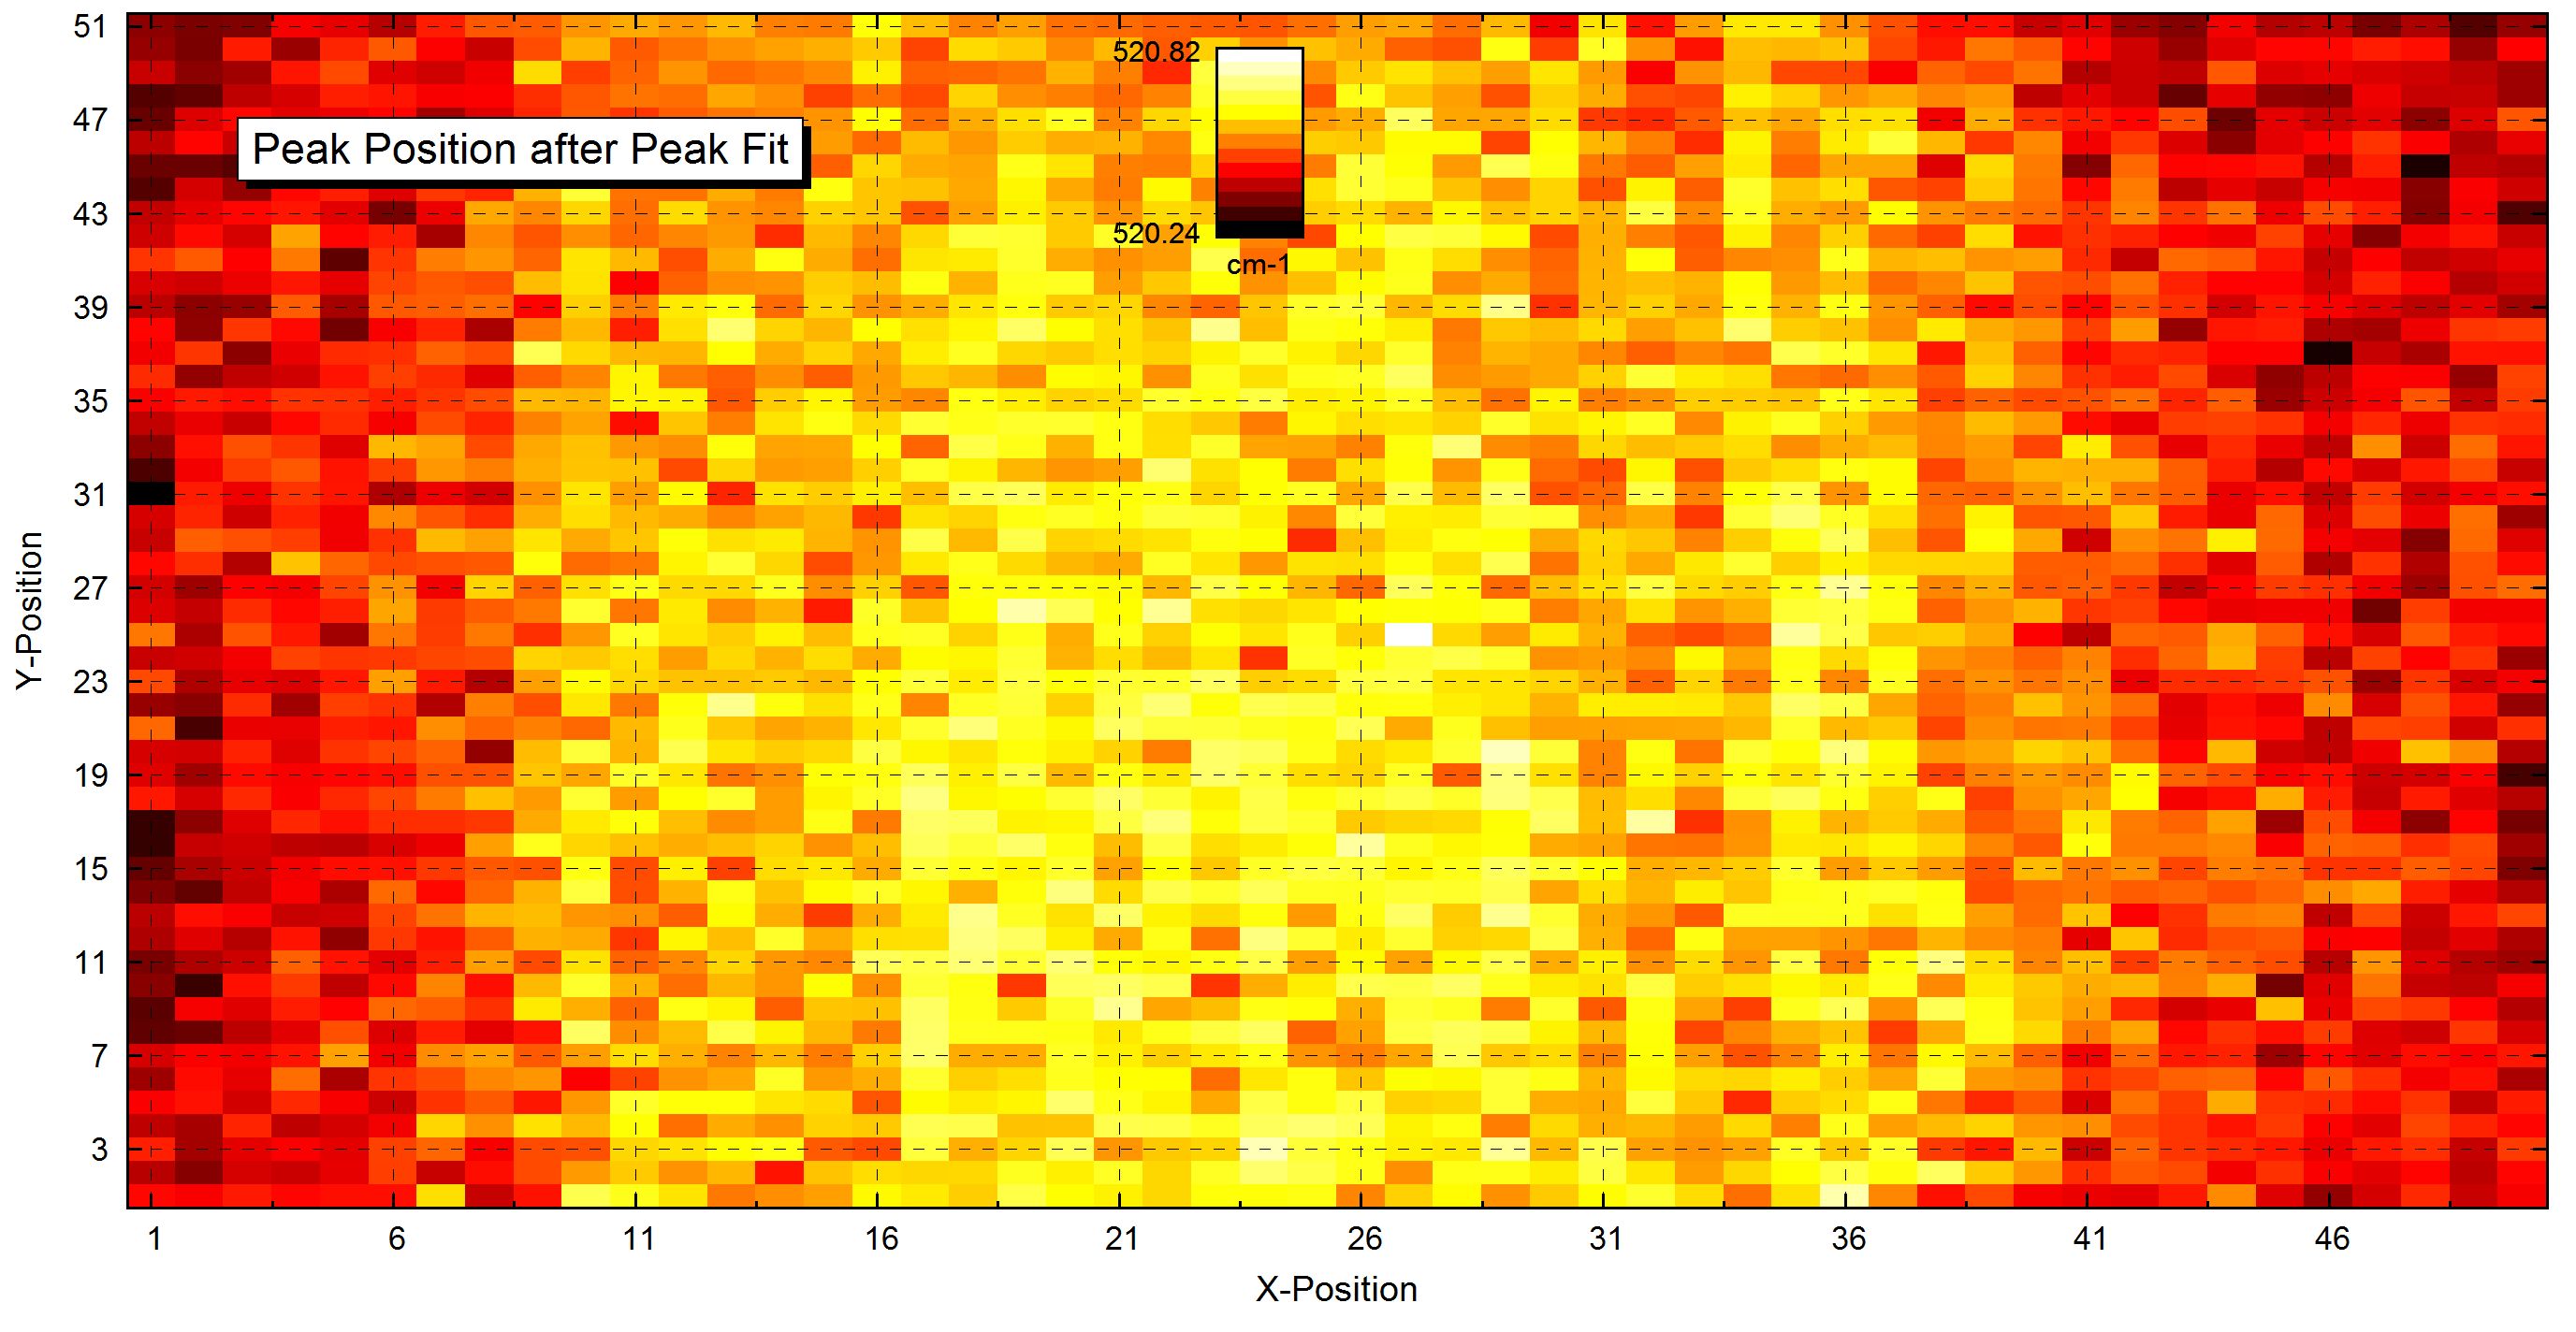
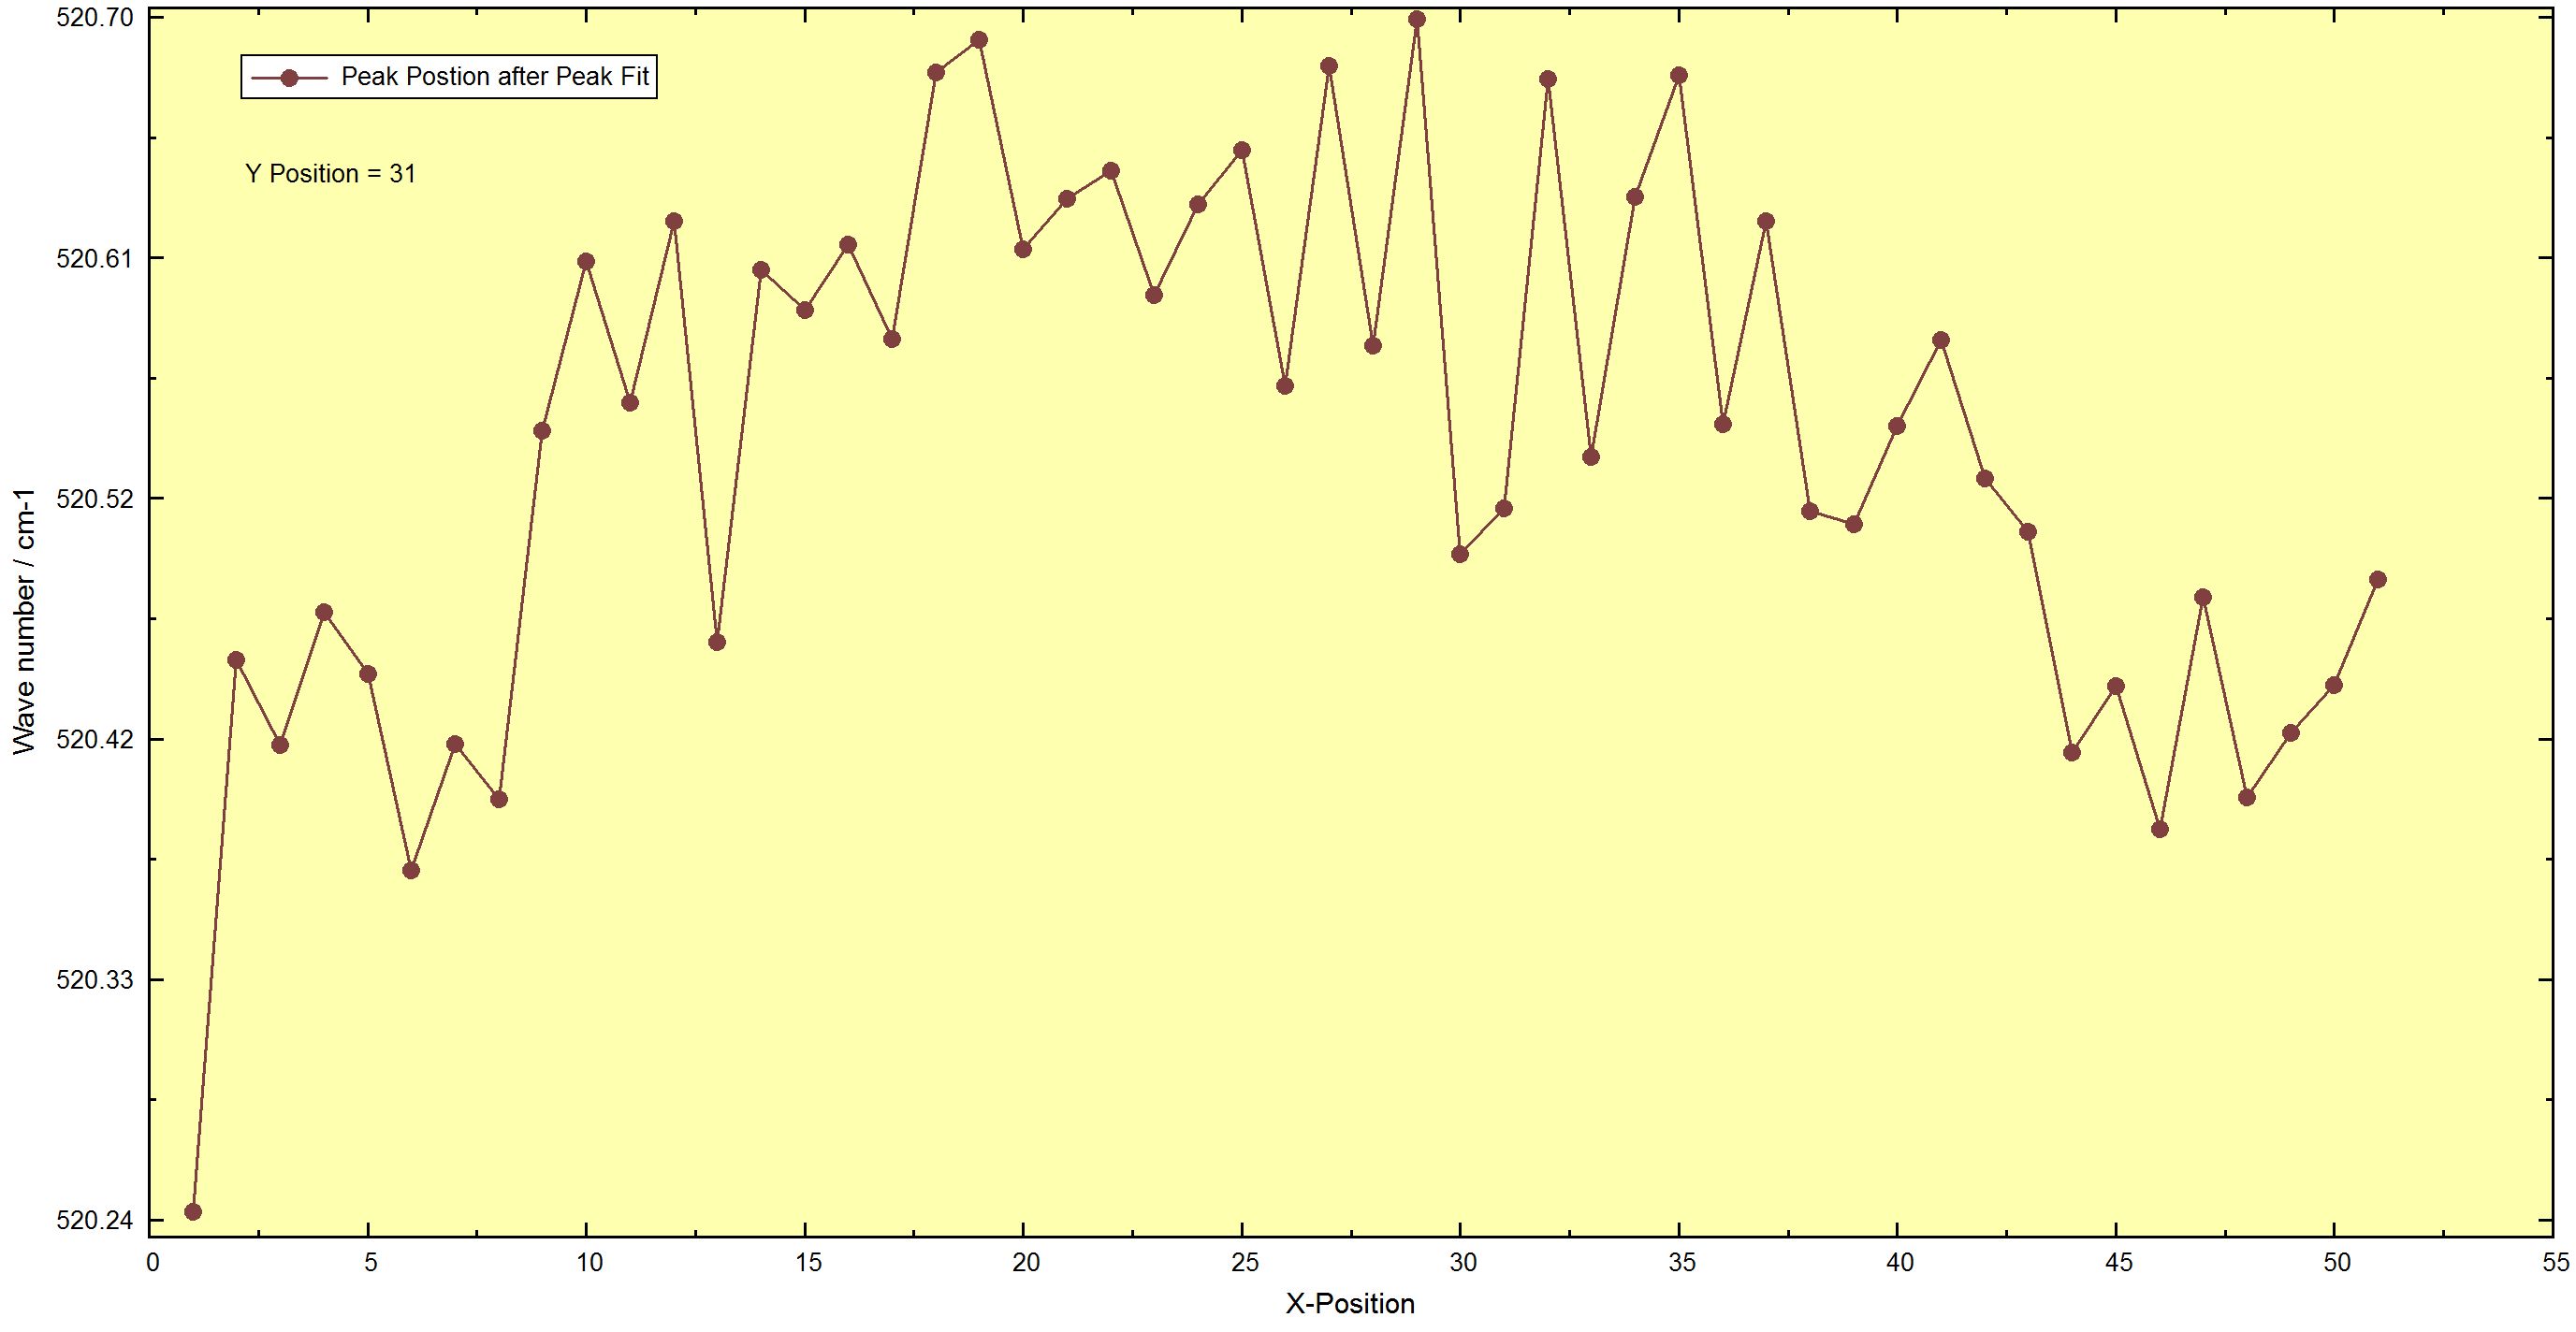
number / cm-1)? |
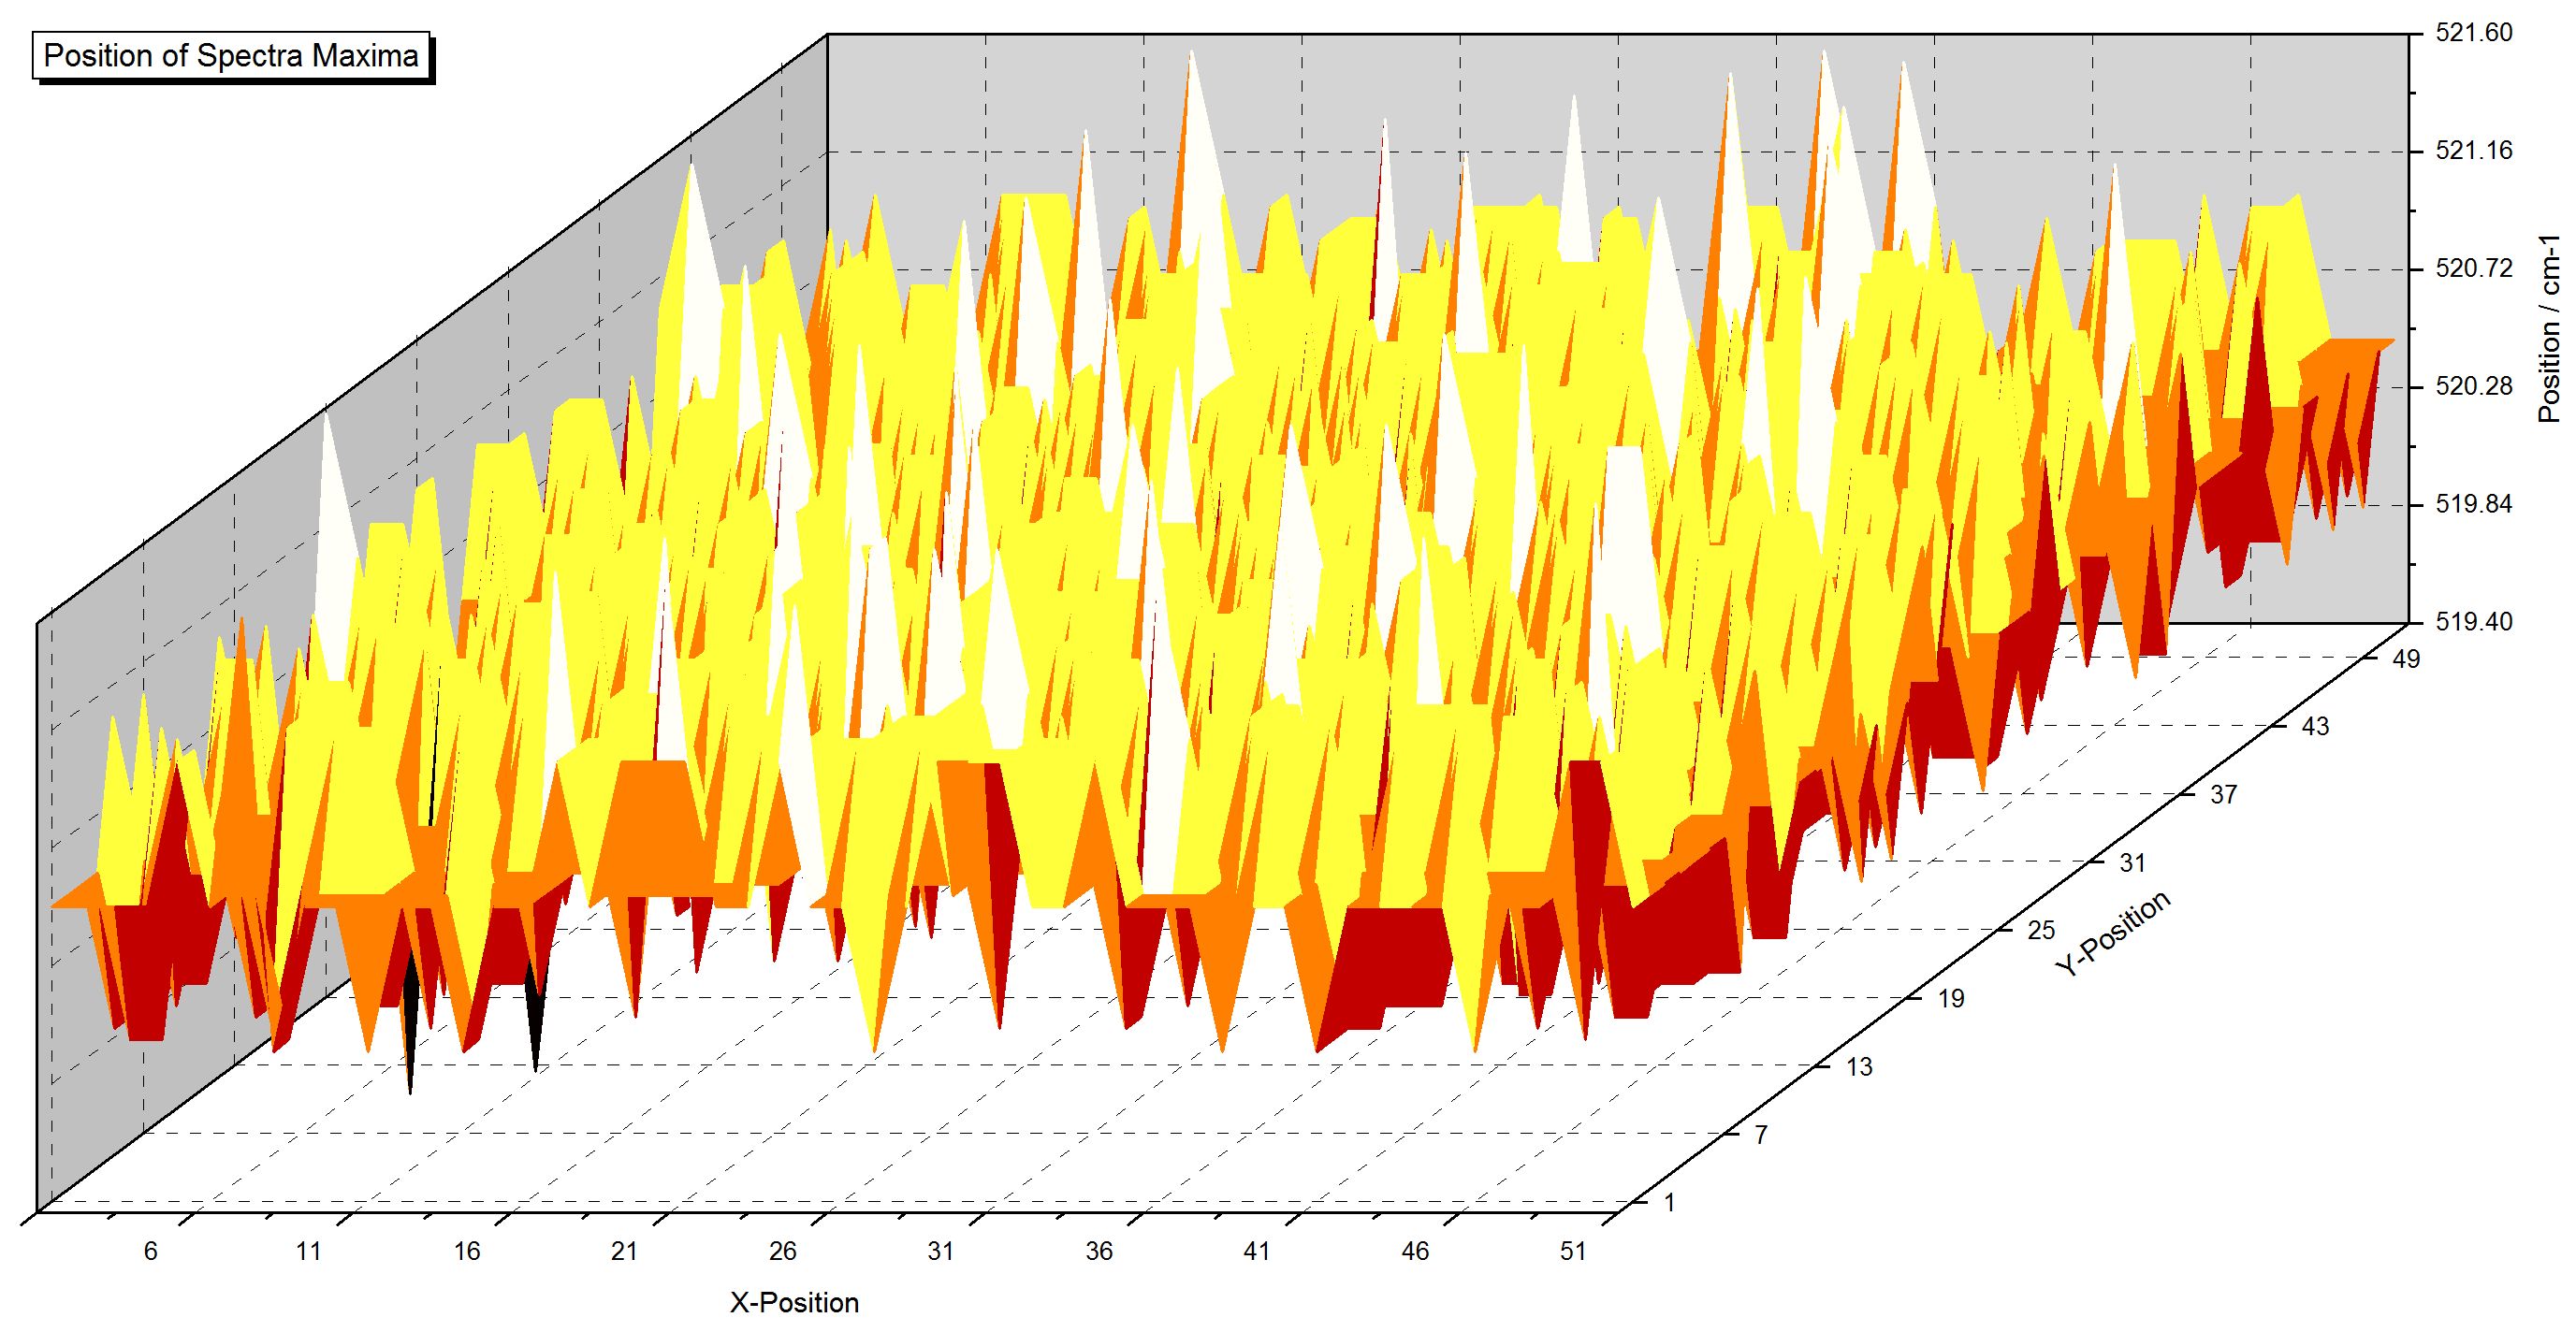
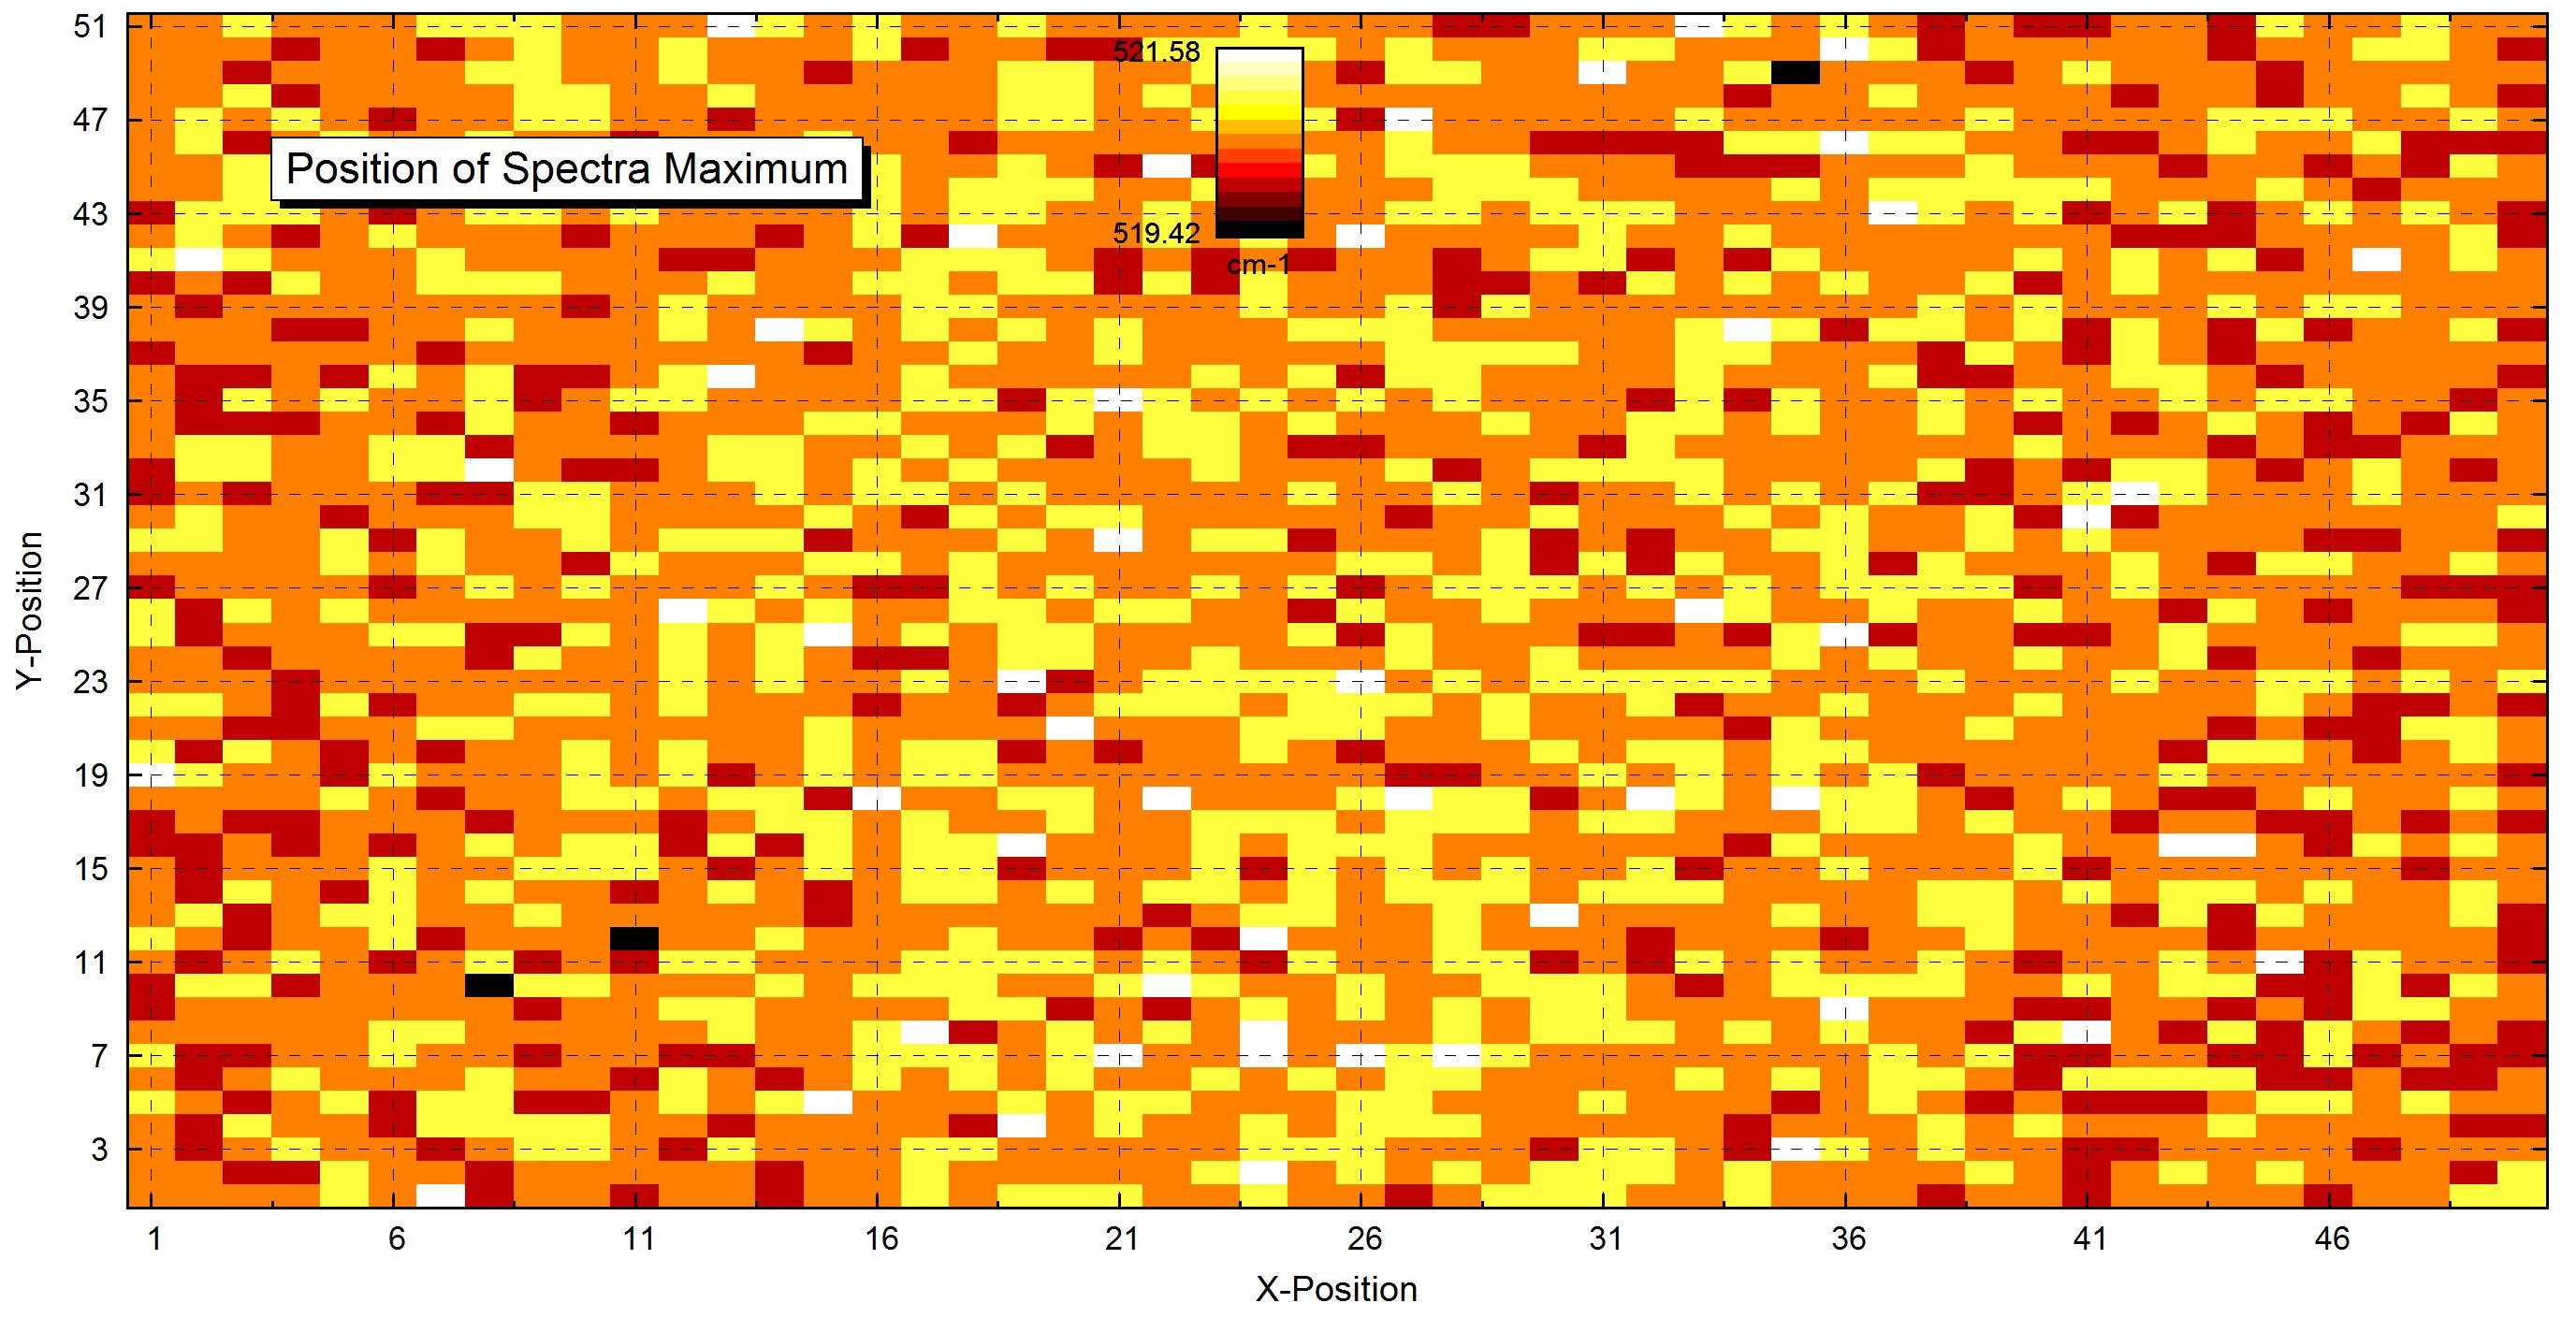
The estimation of the peak position using peak fit for all spectroscopic methodes is
higher with respect of the unsing
of the maximum of original data (also for RAMAN). In order to find the stress of a Si wafer a peak fit of the RAMAN data should be carried out. |
Estimation of peak position of Si
a
RAMAN mapping measurment (solar cell sample)
1. After
peak fit: XY 3D 45 Colour Plot
2. After peak fit: XY 3D Colour Profile
3. After peak fit: Parameter plot
4. Maximum: XY 3D 45 Colour Plot
5. Maximum: XY 3D Colour Profile |
| Windows Video Sequences show dynamic processes using the UNIFIT software. Can I export the video sequence for the implementation into a PowerPoint presentation? |
The UNIFIT software package includes a GIFAnimator programme. With that programme a animated GIFfiles can be generated. |
Animated GIF videos using the batch-export function of UNIFIT and the GIFAnimator software:
1. Cu2p3LongTimeMeasurement.gif
2. Multipoint SDP Measurement of oxidized GaAs, 10 sputter steps
3D-Presentation-As2p3-OxidSignal.gif
3D-Presentation-As2p3-SubstrateSignal.gif
Color-Presentation-As2p3-OxidSignal.gif
Color-Presentation-As2p3-SubstrateSignal.gif
|